
The third-quarter earnings season begins in a couple of weeks. Leading into this, operating earnings estimates for S&P 500 companies have continued to come under pressure (Chart 1), with 2015 now standing at $111.08, which will be down 1.7 percent from last year’s $113.02. With that said, estimates for 2016 have been hanging in there. They have been coming down, but the pace of downward revision is much more benign than what 2015 has witnessed. At current estimates, earnings will grow at 16.5 percent next year (!) – probably unrealistic. But that is another discussion.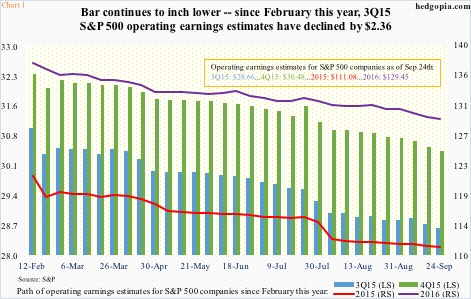
Staying with 2015, third-quarter estimates have come down by $2.36, to $28.66. Last year, they came in at $29.60, so if estimates are met they would have dropped 3.2 percent. Just since the quarter began, estimates have dropped by over a dollar. In other words, it has progressively gotten easier for the companies to clear the hurdle. We will see if they come through.
Semis are no exception in this regard.
SMH’s, the Market Vectors Semiconductor ETF, top holdings are INTC (19.1 percent), TSM (15.6 percent), ASML (six percent), TXN (5.2 percent), and BRCM (4.6 percent). Of these, in the past three months three have seen earnings expectations for the third quarter come down – TSM from $0.46 to $0.43, TXN from $0.75 to $0.68, and BRCM from $0.84 to $0.73. INTC’s is unchanged at $0.59. And ASML’s has gone up – from $0.75 to $0.83.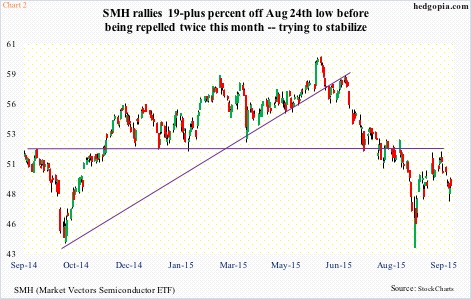
In the right circumstance, semis have room to rally. The only question is, if they begin to get bid up from around here or from a lower level.
During the August sell-off, SMH dropped to $43.53, and traded as high as $60.13 early June. From the August 24th low, it rallied 19-plus percent in no time, only to face stiff resistance at $52 (Chart 2). That support-turned-resistance goes back a year, and was broken in August, and also coincided with the 50-percent retracement of the June-August decline.
As things stand now, it is tough to get wildly bullish on SMH. It is trading below both its declining 50- and 200-day moving averages, as well as shorter-term averages. As a matter of fact, the ETF suffered a death cross early August, right before the onset of the waterfall drop. But near-term is another matter.
Since the September 17th high of $51.88, it lost eight-plus percent in the next five sessions, before rebounding. If it manages to rally to that resistance, we are looking at six percent. Daily momentum indicators are now in oversold territory.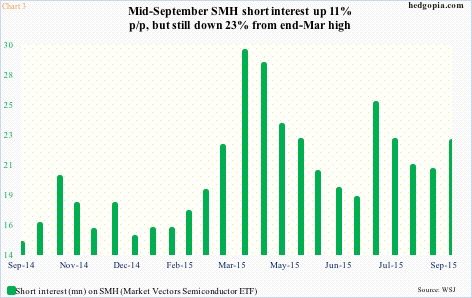
With that said, unlike some other ETFs, such as SPY, the SPDR S&P 500 ETF, SMH shorts are not pressing it. By the middle of September, short interest stood at 22.6 million, versus 20.4 million period-over-period, but below 29.9 million at the end of March. While shorts not getting aggressive is positive from longs’ perspective, this can also mean a lesser opportunity to squeeze the shorts.
Given all this, until there are better signs of which way the ETF is trending, it is safer to move to the sidelines. Shortly after midnight, U.S. equity futures are lower.
Hypothetically last week, October 50 calls (naked) were sold for $1.50. This was always intended to be a short-term trade, but monthly expiration was used as SMH does not have weeklies. If called away, it was an effective short at $51.50 – right near the afore-mentioned resistance. The ETF dropped $1.18 last week, to $48.97. And these calls are now selling for $0.83. Time to close the position, by buying back the option.
Thanks for reading!
