
It has been a while the transports sector has acted like a sick puppy. Yesterday’s action is a welcome change.
IYT, the Dow Jones Transportation Average ETF, peaked November 28th last year at $166.55 – much earlier than other major U.S. indices. The S&P 500 Index, for instance, only peaked on May 20 at 2134.72; since then, from intra-day high to low, it dropped 4.3 percent. IYT, on the other hand, declined 13.8 percent from its late-November high.
Even though transports were showing horrible price action, the Dow Industrials refused to move in sync. The latter only peaked on May 19 at 18351.36. A Dow Theory sell signal was never triggered.
Nonetheless, as IYT ($146.51) came under pressure, it took out one after another support zone. Late May, a death cross took place. Now, moving averages are all pointing lower. As oversold as conditions were, buyers were hesitating to step up to the plate.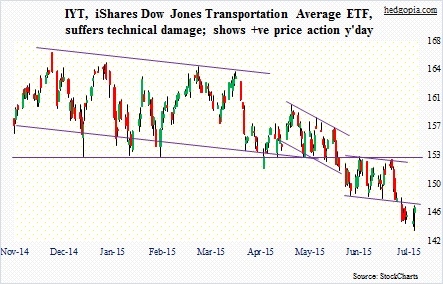
That probably changed yesterday. Within the first hour or so in yesterday’s session, U.S. equities in general made an intra-day low. Other indices went on to make another low in the next hour or so. Transports, however, proceeded to build on the first low. A slight change in sentiment! Plus, IYT’s low was posted right on the lower Bollinger Band. When it was all said and done, it carved out a hammer candle, as did several other indices and ETFs.
This is as good an opportunity as any for bulls to try to hammer out a bottom. The only question is the time frame. The way transports broke down, resistance is galore. IYT has undergone serious technical damage. It is hard to get all bulled up in the medium- to long-term. On a monthly chart, conditions have a ways to go before they get oversold.
This probably creates opportunities for strategies involving options.
In the early hours yesterday, there was a skew in IYT’s put options in the July expiration. As the session progressed and calls came into demand, the skew went away. Nevertheless, it probably is a good time to be collecting premium selling puts.
One way is to do a bullish risk reversal. Hypothetically, in the July expiration, for example, out-of-the-money 147 calls cost $1.53, which can be financed by selling out-of-the-money 146 puts for the same amount. It is a zero-cost trade, and essentially creates a synthetic long position. The assumption here is that a bottom is in for IYT, in which case any upside move beyond $147 in the next eight sessions is free of cost.
But here is the thing. As explained above, the ETF faces tons of resistance – the nearest being $147-$148. It is entirely possible rally attempts get repelled by that resistance, and all the ETF does is go sideways for a while. Alternatively, it takes out $147-$148 before facing resistance at $153. Or, it could simply come under renewed selling pressure, testing recent lows. In this scenario, a cash-secured put is probably a better fit.
July 146 puts fetch $1.53. Either the premium is kept or the short put ensures a long position at $144.47. The low yesterday was $143.50.
Thanks for reading!
