
Commodities had a nice week last week.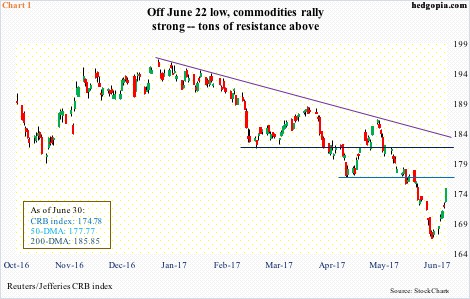
After five consecutive weekly losses, the Reuters/Jefferies CRB index rallied 4.2 percent last week, but dropped 2.8 percent anyway in June – its sixth straight negative month.
Last week’s action is encouraging, but the bulls face tons of overhead resistance.
Immediately ahead lies 177-178, which also approximates the 50-day moving average (177.77). Then comes 181-182, which coincides with a declining trend line from January this year (Chart 1). The 200-day rests at 185.85.
How the index acts around resistance will have repercussions for inflation – or a lack thereof.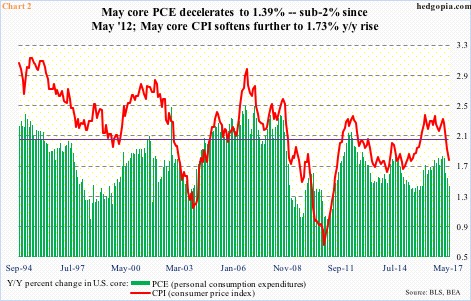
The CRB index comprises 19 commodities: aluminum, cocoa, coffee, copper, corn, cotton, crude oil, gold, heating oil, lean hogs, live cattle, natural gas, nickel, orange juice, silver, soybeans, sugar, unleaded gas, and wheat.
Most recently, it peaked this January at 196.36. That was also the month core inflation – both CPI (consumer price index) and PCE (personal consumption expenditures) – peaked (Chart 2).
Between January and May, core CPI dropped from 2.27 percent to 1.73 percent year-over-year, and core PCE from 1.78 percent to 1.39 percent. Core CPI, in fact, dipped below two percent in April and May. This was after 17 straight months of increase of north of two percent.
Of the two, core PCE is the Fed’s favorite. The last time this measure of inflation rose above two percent was April 2012. A full five years ago.
The Fed has a two-percent inflation target. As do the Bank of Japan and the European Central Bank. For whatever reason, they are all obsessed over two percent – and are hopeful the target will be hit. (The BoJ now seeks to go past two percent, while the ECB aims at below, but close to, two percent.)
The Fed in particular has been raising rates in the face of falling inflation. The Fed funds rate has gone up 100 basis points to 1.16 percent since December 2015. Despite recent softness, it expects inflation to stabilize around the two-percent objective over the medium term.
Hence the significance of Chart 1, which in turn is also a function of Chart 3.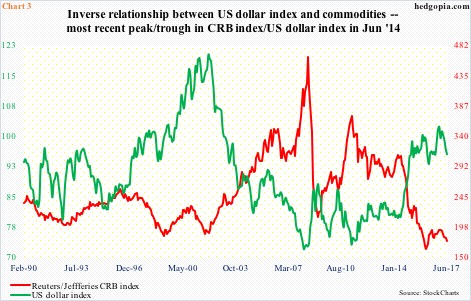
There is an inverse relationship between the US dollar index (95.42) and the CRB index (Chart 3). The former is yet to respond to the Fed’s hawkish posture. Its most recent peak came early this year, and has dropped in five of the last six months.
On Tuesday through Friday last week, the dollar index closed outside the daily Bollinger band. Daily and weekly conditions are grossly oversold. At least a relief rally is due. The level to watch is 96.50-ish.
The bigger question is, will it manage to stabilize and then go on to unwind the weekly oversold conditions? This scenario will have implications for Chart 1.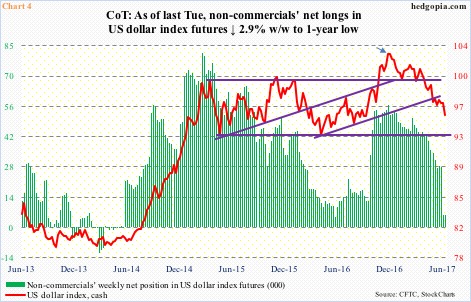
Thus far, non-commercials are not on board this scenario.
This group of traders has shown a tendency to ride the dollar index well – both up and down. Most recently, their net longs in US dollar index futures peaked at 56,712 contracts last December, coinciding with the peak in the cash (arrow in Chart 4).
As of last Tuesday, their holdings had shrunk to 5,458 contracts – a one-year low. They are worth watching.
If non-commercials reverse their neutral/bearish posture, and the dollar index rallies, putting commodities/inflation under further downward pressure, and the Fed still tightens, we know they are targeting asset inflation.
Thanks for reading! Please share.
