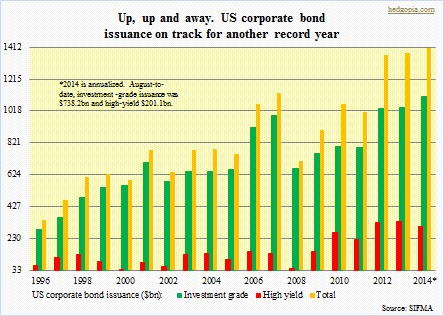
 Another year, another record issuance! Probably. US corporate bond issuance is on course for another record year. August-to-date, as per the Securities Industry and Financial Markets Association, corporations have issued $939.2bn, of which investment-grade is $738.2bn and high-yield $201.1bn. In the comparable period last year, total issuance was $878.4bn, split between $671.1bn investment-grade and $207.3bn high-yield. Annualized, 2014 will have issued $1.41tn, up from $1.37tn in both 2012 and 2013. This would be the fifth consecutive year of $1tn-plus issuance! We are talking five successive $1tn-plus years. The closest comparison can be found in 2006 and 2007 – both $1tn-plus years. Incidentally, that was right before the financial crisis that brought the global financial system to its knees. As well, at $1.11tn annualized, investment-grade is on track for a third consecutive $1tn-plus year. On some level, one can understand why corporations are rushing to lever up. Rates are at historical lows, thanks to the zero interest-rate policy adopted by the Fed. As a corporate treasurer, you would want to lock in those rates. One would think.
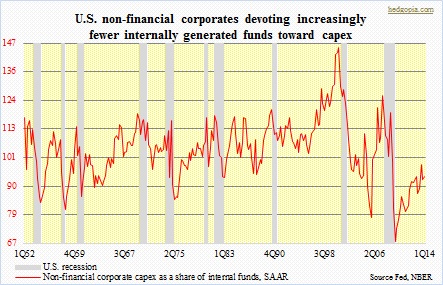
 But here is the rub in all this. First of all, the SIFMA data is in direct contrast with people constantly claiming that US corporations are in the midst of massive deleveraging. Far from the truth. Yes, as the economy began to grow out of the Great Recession, corporations have greatly improved their cash level. But that is looking at one side of the ledger. The other side of course is the liabilities side, and on this front things are anything but healthy. As of 1Q14, US non-financial corporate debt (credit market instruments) stood at $9.6tn, which is of course a record and much higher than the $7.6tn pre-crisis high reached in 4Q08. The SIFMA data tells us why that is. Ironically, corporations have been taking on all that debt at a time when there is not much growth to speak of. Since 2Q09, nominal GDP has managed to grow a whopping (sarcasm!) 21 percent. We are talking 20 quarters. As growth is sub-par, corporations are not gung ho about capital spending. Or is it that growth is sub-par because corporations are not gung ho about capX? Leaving aside the cause and effect side of it, the fact remains that capX remains subdued.
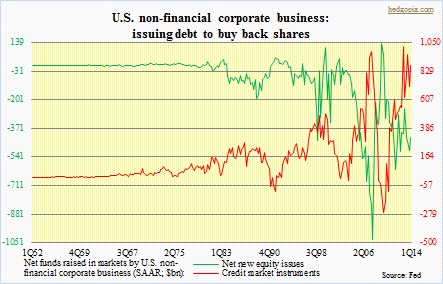
 Which begs the question, why bother raising all that money then? The adjacent chart is the answer. The two components have an inverse relationship. As the debt pile has gone up, share count has gone down. Corporations have been aggressively buying back shares, and at least for now that has proven to be the right strategy. In an environment in which top-line growth is hard to come by, a reduced share count goes a long way in boosting the bottom line. In the big scheme of things, though, it is the wrong strategy to follow. In an equity bull market, each marginal purchase is probably being done at a higher price. Hence, the same amount of money buys fewer and fewer shares. Secondly, good economic times are always followed by bad, and vice versa. It is just a matter of time. When the bad times roll in, investors naturally gravitate toward those with a strong balance sheet. A corporation that has made timely investments in the capital stock will be viewed a lot more favorably than one with a levered balance sheet and who has misallocated funds buying back shares at consistently elevated levels. Last but not the least, debt issued today will have to be either paid off or refinanced when the time comes. We are in the midst of one such refinancing wave right now. But unless we assume an Armageddon scenario, rates are not going any lower. The next round of refinancing likely takes place at higher rates. That is when today’s corporate bravado will come back to bite in the rear. Ah, well! You reap what you sow.

