
U.S. corporate debt issuance continued to decelerate in February. High-yield spreads are not pointing to stress in the system.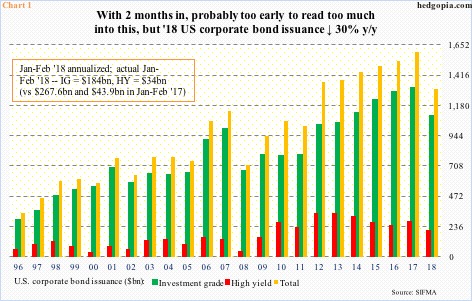
After January’s $133.7 billion, February issuance slowed down to $84.3 billion. As a result, the first two-month total, comprised of $184 billion in investment-grade (IG) and $34 billion in high-yield (HY), are now down 30 percent from last year’s $311.5 billion, made up of $267.6 billion in IG and $43.9 billion in HY.
Granted these are merely two months, but annualized, 2018 is on pace for $1.31 trillion, substantially below last year’s $1.59 trillion (Chart 1). Should the momentum continue, this will be a first yearly decline in seven years.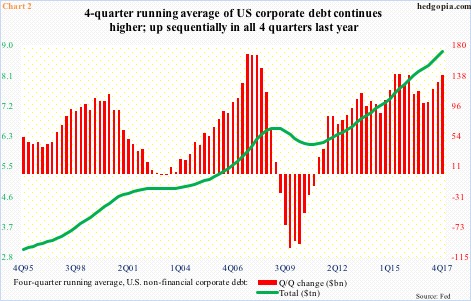
This would have come after non-financial corporate debt (bonds and loans) ended 2017 at a record $8.9 trillion. Chart 2 uses a four-quarter running average, with the green line persistently on the rise since 2Q11. Last year, the red bars grew sequentially every quarter.
Post-financial crisis, low rates provided a big tailwind for debt issuance. They have risen a tad of late, but rates are still very low historically. So what changed? Why this sudden softening in issuance?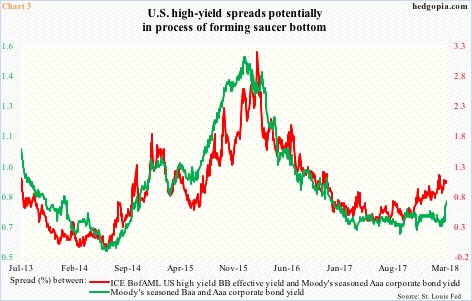
The Tax Cuts and Jobs Act of 2017 – signed into law on December 22 – limits interest rate deductibility of corporate interest expense. Under the new law, a company can only deduct interest expense of up to 30 percent of Ebitda (earnings before interest, taxes, depreciation and amortization). This may or may not be a factor, but if it is, then it is likely junk companies get hurt the most, as they pay higher rates.
In the first two months this year, HY issuance is down 22.4 percent from the corresponding period last year – on course for $204 billion, which will be the lowest total since 2009 (Chart 1). Any sign of stress in the secondary market, then? Not much, although spreads have been rising a tad.
Chart 3 plots two yield spreads – one between ICE BoAML BB high yield and Moody’s Aaa corporate yield, and the other between Moody’s Baa and Aaa corporate yields. In the latter, both are IG, with one medium-grade and the other prime. The former, on the other hand, measures HY spreads over IG, and has been rising for six months now, but nowhere near what was witnessed late 2015/early 2016 (Chart 3).
Rather interestingly, the green line in the chart is at a 15-month high. Within IG, lower-quality is demanding more yield. More importantly, perhaps, both lines seem to be forming a bottom – kind of a saucer bottom.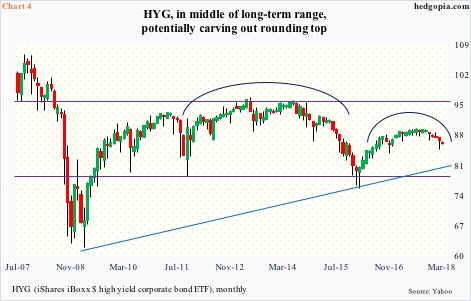
Enter Chart 4, which plots monthly candles for HYG (iShares iBoxx $ high yield corporate bond ETF). It, too, is in the process of forming something important technically – a rounding top, opposite to what spreads in Chart 3 are forming.
The ETF (85.66) has gone back and forth within a range for over a decade now. The low end lies around 79. Right around there – around 80 – lies support from a rising trend line from the low of March 2009. This dual support in all likelihood gets tested in due course.
In this scenario, the path of least resistance for spreads in Chart 3 is higher medium term, and is worth watching. How this evolves can have repercussions for debt issuance.
Thanks for reading!
