
Tomorrow, April’s new home sales come out. March was down 1.5 percent month-over-month to a seasonally adjusted annual rate of 511,000 units. The cycle peaked at 545,000 units in February last year – a seven-year high. The median price in March dropped 3.2 percent m/m to $288,000, down from the all-time high $317,000 last November.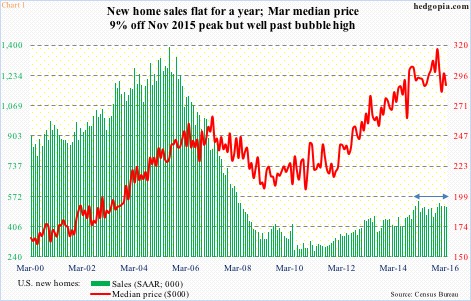
Post-bubble recovery in U.S. housing has been characterized by rapid price appreciation.
The median price of a new home peaked in March 2007 at $262,600, which was surpassed in February 2013 ($265,100). Price continued to firm up, even as sales were nowhere near bubble highs (Chart 1).
Existing home sales are no different.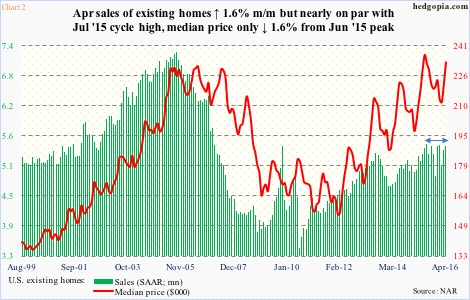
During the bubble, the median price of an existing home peaked at $230,400 in July 2006. This was not surpassed until June last year when price jumped to $236,300. That high has not been surpassed but at $232,500 April came pretty close (Chart 2).
Sales of existing homes in the meantime have flattened out for nearly a year. April rose 1.7 percent m/m to a seasonally adjusted annual rate of 5.45 million units, a stone’s throw away from cycle-high 5.48 million units last July.
Once again, as with new homes, the median price of existing homes has appreciated much faster than sales.
From the perspective of affordability, rapid price appreciation is a limiting factor, particularly given sluggish growth in wages and in income.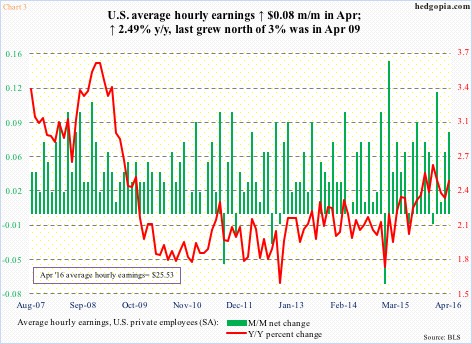
In April, average hourly earnings of private-sector employees grew at an annual rate of 2.5 percent. The growth rate has been inching up since December 2014, or even October 2012, but remains very subdued versus past recoveries. The last time earnings grew with a three handle was in April 2009 (Chart 3).
The point is, mortgage rates are favorable for housing, but not income and price.
Given this backdrop, the rather sideways action in sales of both existing and new homes should not come as a surprise, which probably explains why ITB, the iShares U.S. home construction ETF, remains range-bound, and cannot break out.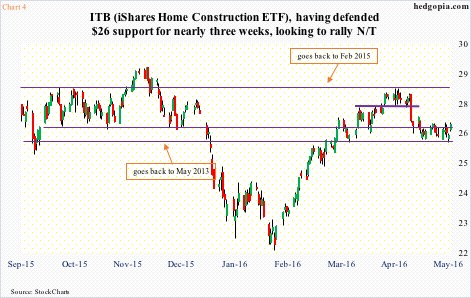
The ETF has been bobbing up and down between $26 and $28 for over a year now. In fact, the lower end of the range goes back three years. ITB met with resistance at the upper end a month ago, and the subsequent selloff has seen buyers stepping in at/near the lower end. For nearly three weeks, the $26 support held firm.
On a daily chart, ITB looks to be itching to go up. In the right circumstances, there is room to rally to the upper end of the range (Chart 4). In this scenario, this potentially creates a shorting opportunity – or perhaps deploy a credit call spread.
This also suggests shorts are better off covering for now.
To refresh, hypothetically on April 20th, ITB ($26.66) was shorted at $27.66. This was followed by two weekly short puts – one on May 10th and the other on May 18th – collecting a cumulative $0.35.
The May 20th 26 put fetched $0.15. If assigned, the position would have been closed for a profit of $2.01. Unassigned, the short price would rise to $28.01, which is where we are currently. Covering the short nets $1.35.
Thanks for reading!
