Gold faced pressure after running into resistance six weeks ago. The subsequent drop cost the metal long-term support at $1,300-plus. Gold bugs were not ready to give in that easy, though. They defended a rising trend line from December 2016. Now, they need to conquer that lost support. Odds are decent.
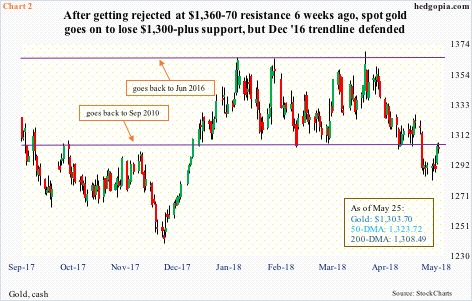
On April 11, spot gold reached an intraday high of $1,369.40/ounce before retreating. The metal has faced resistance at $1,360-70 since June 2016. Following that unsuccessful test, it went on to lose $1,300-plus. This support goes back to September 2010. On May 21, gold bottomed intraday at $1,281.20.
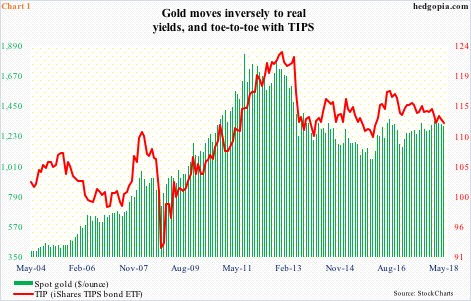
The yellow metal has gone toe-to-toe with TIP (iShares TIPS bond ETF).
TIPS (Treasury inflation-protected securities) pay interest rate as do plain-vanilla Treasury securities. The difference between the two is that the principal of TIPS is adjusted to reflect the change in the CPI. The plain-vanilla securities carry no such inflation protection. Ten-year T-yields, therefore, amount to the 10-year TIPS rate plus expected inflation.
Gold moves inversely to real yields. In other words, it moves in tandem with TIP (Chart 1). Most recently, the latter bottomed on May 17.
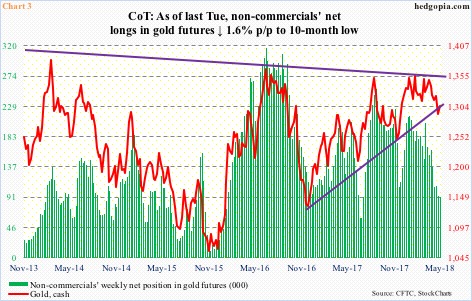
Bids showed up on gold on May 21 at an interesting juncture. A rising trend line from December 2016 draws to $1,280s (Chart 3). Prior to last Thursday’s 1.2 percent rally, there were six straight sessions of long-legged dojis, spinning tops and hammers (Chart 2). After a 6.4-percent, 29-session drop, the bull-bear duel was on. In a long-legged-doji session Friday, gold ($1,303.70) closed right underneath the aforementioned broken support. The 200-day moving average rests right there.
Gold bugs need to take out this resistance. The way bids have showed up in the past several sessions, it is their ball to lose right now.
Incidentally, between April 11 and May 21, GLD (SPDR gold ETF) lost $312 million, while (iShares gold trust) gained $491 million (courtesy of ETF.com). In the aggregate, this was not bad given the decline in the metal’s price.
Non-commercials, however, were different. They continued to reduce net longs in gold futures. Most recently, their holdings peaked at 203,354 contracts in the week to March 27. By the week ended April 10, this stood at 155,372. Last Tuesday, this was cut down to 90,957 (Chart 3). For a change, the pace of decline slowed last week, down 1.6 percent week-over-week.
These traders tend to be trend-riders, and do a good job at it. The cash will get a tailwind if they start adding to net longs.
Should things evolve this way, there is room for short squeeze – duration and extent notwithstanding.
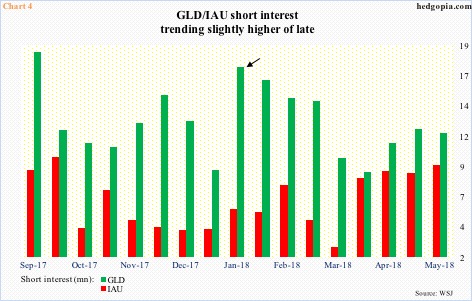
Short interest on GLD is nowhere near the high of mid-January (arrow in Chart 4), but has built up slightly since bottoming at the end of March. There has been a similar buildup in IAU short interest the past couple of months. For this to possibly turn into a tailwind for these ETFs, gold bugs have a task at hand, which is conquering the aforementioned resistance on the cash. Once $1,300-plus is won over, gold’s near-term jigsaw puzzle starts falling into place, particularly drawing in technically-oriented traders.
Thanks for reading!

