
Things are slowing down. From job creation to real GDP, there are signs of deceleration. CEOs are beginning to sound pessimistic. Often, this can act as a self-fulfilling prophecy. Amidst this comes the sell-side’s overly optimistic estimates for small-cap operating earnings for next year.
Activity is in deceleration. The US economy created 390,000 non-farm jobs in May for a monthly average of 488,000 in the first five months this year. This compares to a monthly average of 562,000 last year.
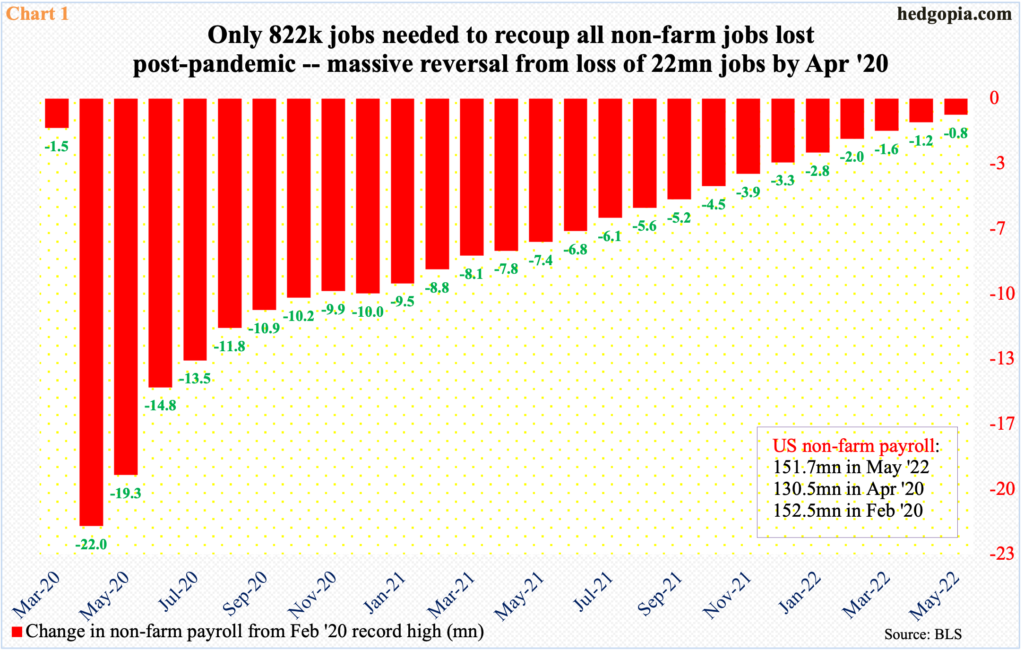
Concurrently, the economy is merely 822,000 jobs short of recouping all the jobs lost post-pandemic (Chart 1). From the February 2020 high of 152.5 million to April’s (2020) 130.5 million, 22 million jobs suddenly vanished.
This led to massive stimulus – both on the fiscal and monetary front. On the latter in particular, the Fed is now in a tightening mode. It is already impacting economic activity and more is on the way.
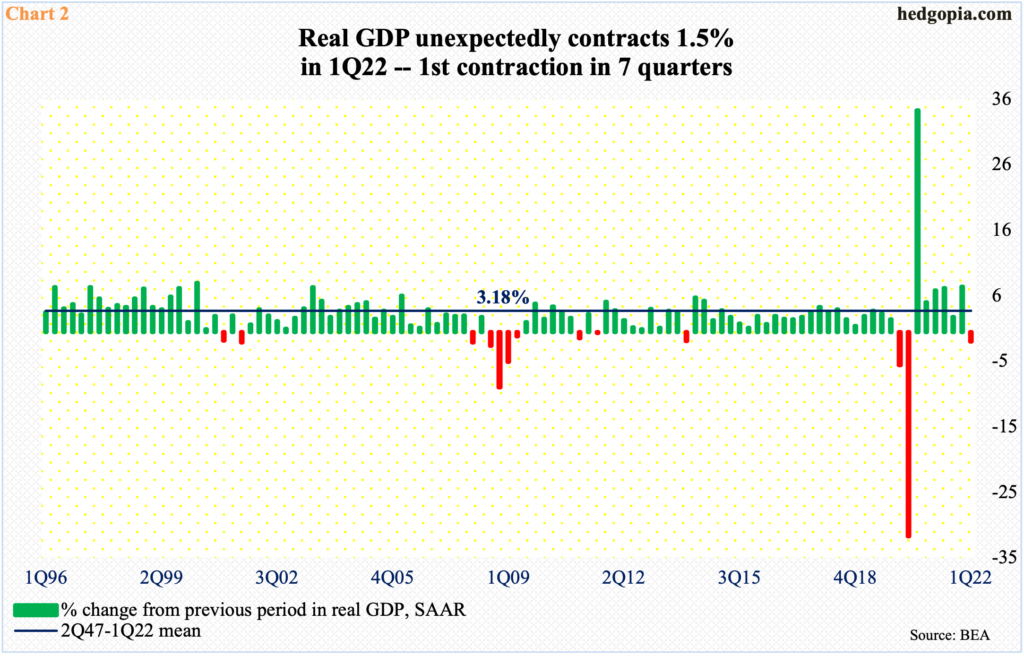
The second estimate showed last week that real GDP shrank 1.5 percent in the first quarter. This was the first contraction in seven quarters (Chart 2). In the first and second quarters of 2020, as Covid-19 was wreaking havoc, the economy tumbled 5.1 percent and 31.2 percent respectively. The massive liquidity that followed lit a fire under the economy. In 3Q20, it surged 33.8 percent.
Pre-pandemic, on a nominal and real basis, the size of the economy respectively peaked in 4Q19 at $21.7 trillion and $19.2 trillion. The economy is much larger now – at $24.4 trillion and $19.7 trillion in 1Q22, in that order, with the latter having peaked at $19.8 trillion in 4Q21. As of June 1, the Atlanta Fed’s GDPNow model was forecasting real GDP to grow 1.3 percent in the current quarter, down from its estimate of 1.9 percent on May 27.
The message is the same: deceleration.
This is also reflected in CEO confidence surveys and their comments.
In recent weeks, Tesla (TSLA) and Facebook owner Meta Platforms (FB), among others, announced layoffs or hiring freezes. Jamie Dimon, who leads JP Morgan (JPM), said last week that a “hurricane” is headed for the US economy.
The tightening monetary condition is front and center. The Conference Board’s CEO Confidence survey dropped to 42 this quarter from 57 in 1Q. Three-fifths of CEOs expect inflation to come down over the next few years. They also believe that the interest rate hikes that will tame inflation will cause a mild recession.
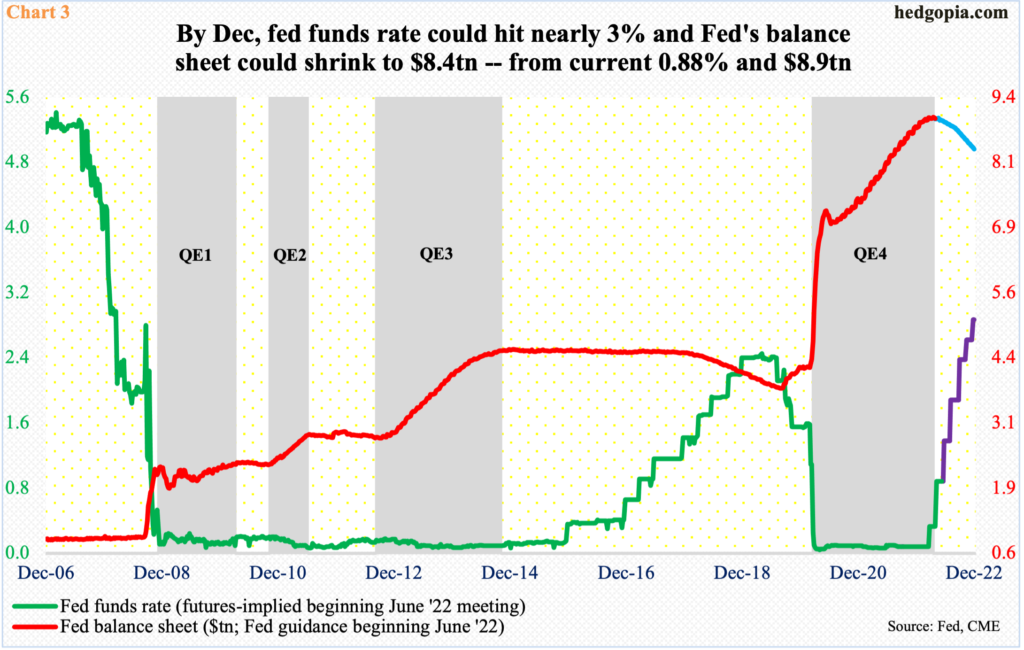
As things stand, in the futures market, traders have the fed funds rate rising to nearly three percent by December. This year, the Fed has raised twice – by a total 75 basis points – to a range of 75 basis points to 100 basis points. Concurrently, it is reducing its balance sheet, which has been guided to reach $8.4 trillion by year-end from the current $8.9 trillion (Chart 3).
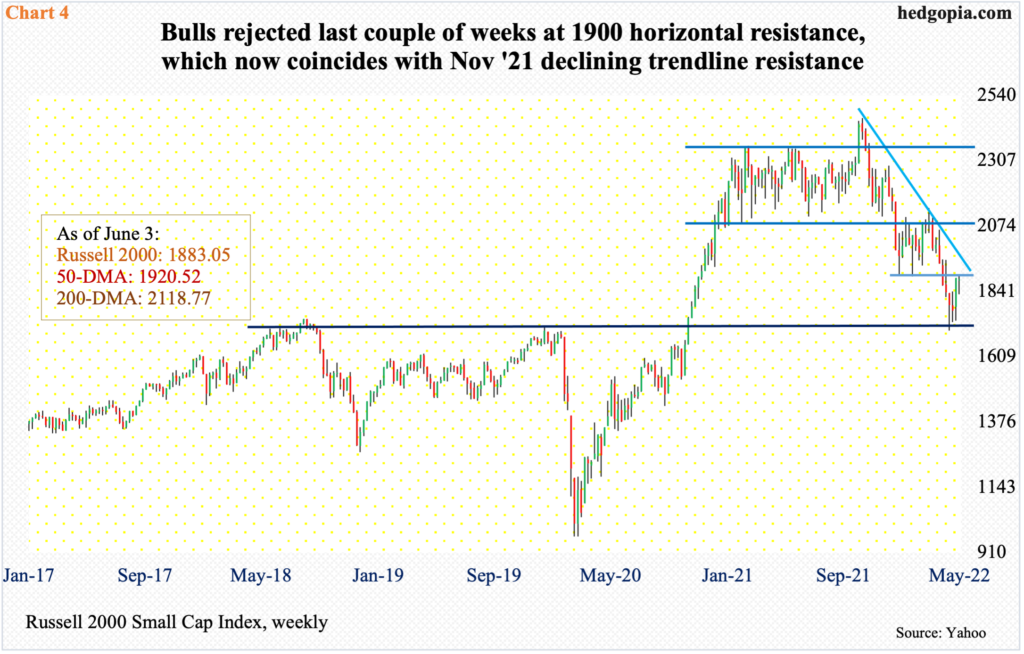
Small-caps, which tend to have a larger exposure to the domestic economy versus their large-cap peers, will suffer in this scenario. Stocks are anticipating this. From last November’s intraday high of 2459 to the May 12 (this year) low of 1701, the Russell 2000 tumbled 30.8 percent.
It is too soon to say if last month’s low represents a sustainable bottom, but so far so good. This was a successful retest of a breakout from November 2020 (Chart 4). The small cap index needs to reclaim 1900 to build on this. It played ping pong between 2080s and 1900 for three months before breaching the support in late April. Before that in mid-January, a major range breakdown occurred, losing 2080s; for 10 months, the Russell 2000 went back and forth between 2080s and 2350s.
Last week, sellers showed up at 1900, with the week ending at 1883. The daily is overbought. In the event of downward pressure, bulls need to defend 1830s. A breach of 1700 will signal investors are pricing in a lot worse in the US economy.
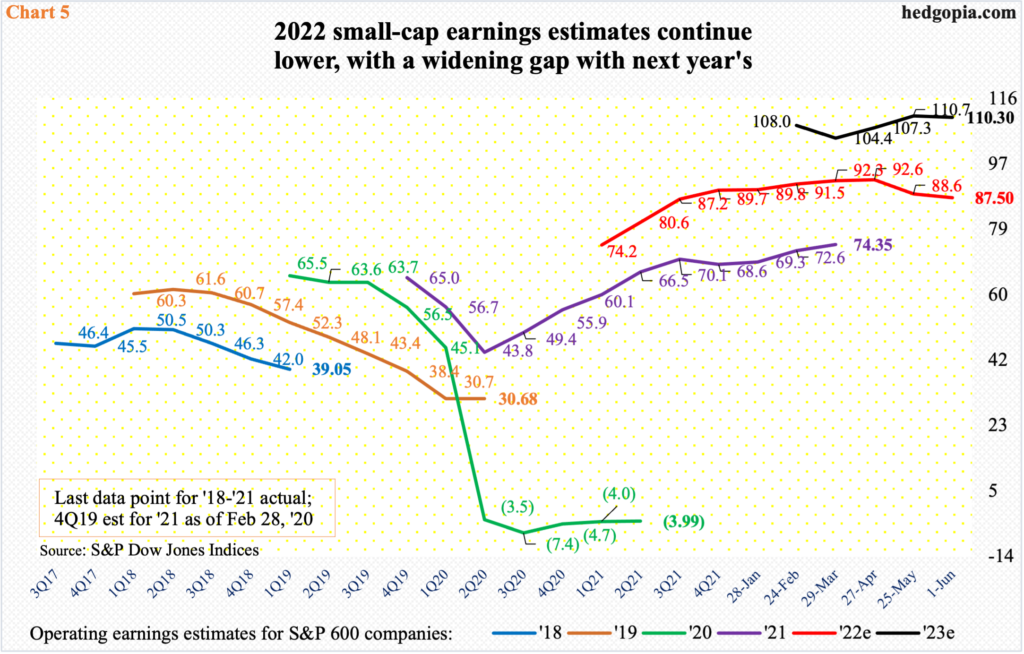
Interestingly, the sell-side continues to maintain a sanguine outlook for next year. These analysts expect S&P 600 companies to ring up $110.30 in operating earnings next year, which is just under the record $110.69 expected in the week before. The revision trend is upward.
This year’s, however, is going the other way – currently at $87.50, down from $92.70 expected as of April 12. Next-year’s was $103.61 as of March 16. The gap between this year and next is widening. Next year’s is expected to grow 26.1 percent.
This obviously comes at a time when the Fed is in a tightening mode and there are widespread signs of deceleration in economic activity. It is probable 2023 estimates will be revised downward in due course.
The question is if this is already anticipated and priced in – or not. Hence the significance of the current 1700-1900 range the Russell 2000 finds itself in. Bulls do not want to see a range breakdown. The prior range breakdown mid-January led to a sustained selloff.
Thanks for reading!
