
US corporate bond issuance is on course for a sharp snapback from last year’s seven-year low. Treasury issuance continues rapid growth trajectory, as it needs to keep up with growing deficit spending. Despite what we hear and read, there is not much deleveraging going on.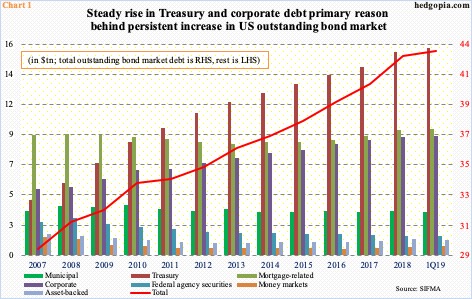
The US bond market grew $406.3 billion to $43.1 trillion in 1Q19. The red line in Chart 1 has a flattish look, but this is because the latest data is quarterly, not annual, which is otherwise the case. By the time 2019 is over, odds are it should steepen.
The trend has always been up – from lower left to upper right. SIFMA data show the bond market was $1.9 trillion big in 1980. The upward momentum did not break post-financial crisis. Since 2008, $11.6 trillion has been added.
The market is divided among seven categories, of which Treasury and corporate have been posting the biggest increase. Despite what we hear, there is not much deleveraging going on. Post-crisis, the mortgage-related category is about flat, up $349.5 billion since 2009. But the Treasury bond market has gone up by $10.1 trillion and corporate by $3.8 trillion.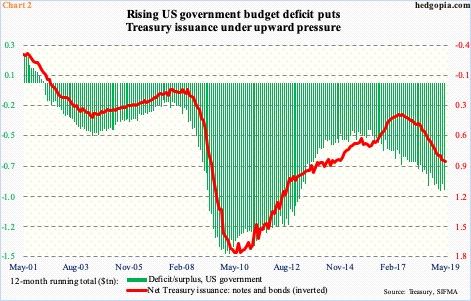
Treasury issuance is needed to meet with the persistent increase in federal deficit.
Chart 2 plots the difference between receipts and outlays of the US government with the issuance of notes and bonds by the Treasury. The calculation is done on a 12-month running total basis. In April, the deficit amounted to $924.4 billion. It has been trending higher since January 2016 when it stood at $403.6 billion.
Amazingly, the red ink has continued to grow during an economic expansion, which is just a few weeks short of completing a decade and is showing signs of wear and tear. We can just imagine how the overall picture would look like the next time the economy seriously shifts downward.
Hence the growing odds that Treasury issuance continues higher. In the 12 months to May, it totaled $807 billion. The red line in Chart 2 has trended higher since bottoming at $335 billion in July 2017.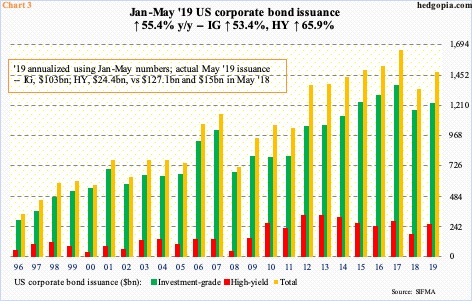
Corporate bond issuance is the same way.
In May, investment-grade issuance totaled $103 billion and high-yield $24.4 billion. In the first five months of the year, they were $509.8 billion and $106.6 billion respectively. At this pace, total issuance is on course for $1.5 trillion this year, which would be up substantially from last year’s $1.3 trillion (Chart 3). That said, 2018 issuance was down 19 percent from 2017’s record $1.7 trillion, so the growth rate this year looks exaggerated. Nevertheless, at the current pace, last year’s downward momentum would have been broken.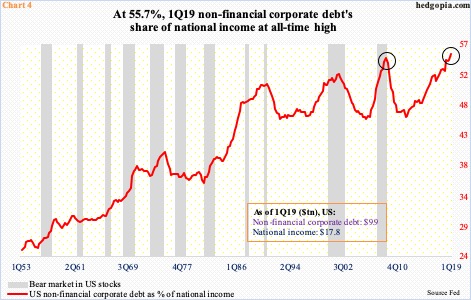
This comes at a time when corporate debt is already at a lofty level.
In 1Q19, US non-financial corporate debt increased $187.9 billion sequentially to $9.9 trillion – a new high. Since Great Recession ended in 2Q09, these corporations have added $3.4 trillion.
For perspective, Chart 4 calculates corporate debt as a percent of national income. The latter was $17.8 trillion in 1Q19. During the quarter, corporate debt made up 55.7 percent – once again a new high. This is uncharted territory. This in and of itself does not mean the metric has to revert. The upward momentum has been intact for decades. But the higher it goes, the more the pain when the law of gravity finally exerts control.
Thanks for reading!
