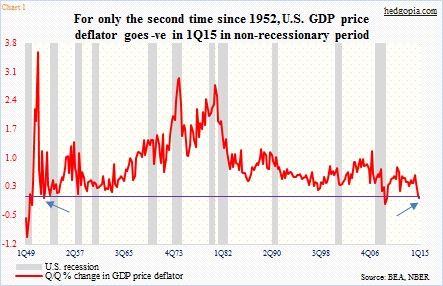
- For only 4th time in six-plus decades, U.S. GDP price deflator goes negative
- Macro data weaker than expected this week, but rates come under upward pressure
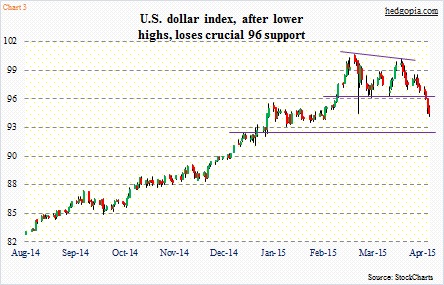
- Dollar plays crucial role in inflation outlook, breaks support, could be headed toward 92
If you felt like getting out the torch to go looking for inflation post-1Q15 GDP print, you probably are not alone.
For only the second time since 1Q52 the GDP price deflator has gone negative in a non-recessionary period (Chart 1). As a matter of fact, recession or no recession, quarter-over-quarter this series has only dipped into the negative territory four times in six-plus decades – two of them in 2009. That is how rare this occurrence is.
The other inflation measure to have come out this week was not as bad, but continues to point to a low-inflation environment. Core PCE deflator in March rose 0.3 percent month-over-month and 1.3 percent year-over-year. The last time core PCE managed to rise at a two percent annual rate was in April 2012!
What then are we to make of markets pricing in higher inflation?
On Wednesday, the day the GDP report was published, yields on 10-year Treasurys surged six basis points (up as much as 11 basis points at one time). This was a week in which macro data continued to come in lower than/as expected (including real GDP growth of a puny 0.2 percent!), yet from trough to peak to date yields rose 19 basis points.
In truth, fund flows into TIP (iShares Barclays TIPS bond fund) have been rising in recent weeks. Interest rates were already acting as if they were expecting a hawkish tone out of the FOMC minutes due this week. But the minutes were neutral at best and dovish at worst.
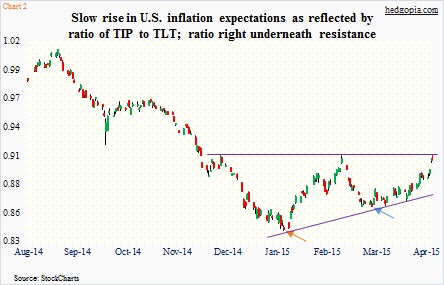
Also, the ratio of TIP to TLT (iShares Barclays 20+ year Treasury bond fund) has been on the move since the beginning of February (brown arrow in Chart 2) and most recently a month ago (blue arrow). Treasury inflation-protected securities protect investors from inflation risk.
What might be causing this fear of inflation?
Here are some possibilities: (1) The Fed continues to expect the effect of oil prices on inflation to be temporary. (2) From WMT to AET to TGT, there is some incipient movement to raise wages. This week, the employment cost index for 1Q15 was published, and total comp (includes not only wages and salaries but also benefits) rose 2.8 percent year-over-year, up from 1.7 percent in 1Q14. (3) The dollar has continued to weaken, and if this persists, it can be a source of upward pressure on inflation. And last but not the least (4) Oil price continues to rally (also a dollar play).
Of this, dollar dynamics probably deserve the most attention. The U.S. dollar index just took out the important 96 support, and could very well be headed toward 92 in the right circumstances, which also approximates its 150-day moving average (Chart 3).

