
Post-Trump victory, the Treasury yield curve has moved up as well as steepened, with the 10-year yield rising 47 basis points to 2.34 percent. Yields have risen one full point since the July 6th all-time low of 1.34 percent.
Inflation expectations have gone up. The five-year, five-year forward inflation expectation rate rose from 1.89 percent on November 8 (election day) to 2.06 percent two sessions later, before backing off to two percent. Rightly or wrongly, it is sniffing inflation.
Markets expect the Fed to tighten in its December 13-14 meeting. Should the new administration succeed in pushing through its planned tax cuts and infrastructure spending, the Fed in all probability will be forced to take a much more hawkish stance.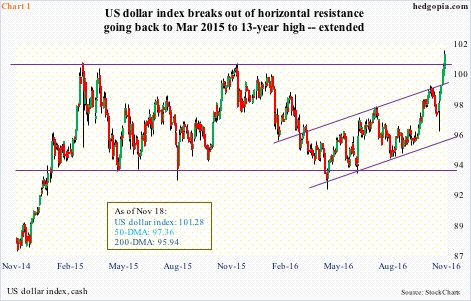
The US dollar index has broken out, to a 13-year high. In March 2015, after rallying 25-plus percent in nine months, it began to go sideways/down after hitting 100.71. In November that year, the 100-plus level was tested again – unsuccessfully. The subsequent drop bottomed in May this year, resulting in a rally that once again tested the 100-plus. This time, it was a success (Chart 1).
Thus far, U.S. equities have rallied with the dollar index. The Dow Industrials is at a new high. The Russell 2000 small cap index just took out its June 2015 high for a fresh high. Both the S&P 500 large cap index and the Nasdaq 100 index are within spitting distance of their respective all-time highs.
There is excitement in the air.
But how long before we start hearing the adverse side effects of a strong greenback?
As per the Bank for International Settlements, non-bank borrowers in emerging markets have accumulated north of $3 trillion in dollar-denominated debt. Yield-hungry investors flooded into this debt post-financial crisis. Strong dollar is bad news for these issuers. Post-election, both stocks and bonds of emerging markets have taken a beating.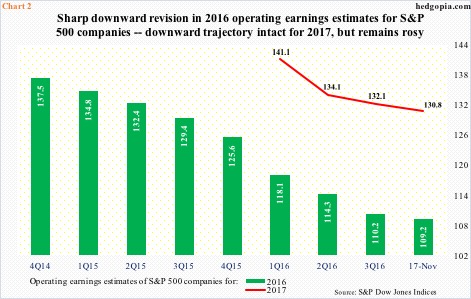
Staying within the U.S., as noted above, since it peaked in March 2015, the dollar index pretty much traded within a range of 100-plus and 93-plus (Chart 1). This is one reason why the sell-side is so optimistic about 2017 earnings.
However, since the afore-mentioned low in May this year through last Friday’s high, it has rallied 10.5 percent, with a breakout to boot. This cannot possibly be good for earnings.
In the middle of January this year, 2017 operating earnings estimates of S&P 500 companies were $141.11. As of last Thursday, this was cut down to $130.84. Assuming these estimates, as well as for 2016, come through, 2017 earnings would have grown by nearly 20 percent, which would be phenomenal considering that they are expected to grow by 8.7 percent this year.
Further, the prevailing revision trend is downward.
In February last year, 2016 was expected to bring in $137.50, now at $109.18 (Chart 2). Similarly, at the end of 2Q14, 2015 was expected to earn $137.50; when it was all said and done, $100.45 was earned. Point is, a strengthening dollar cannot be conducive to stopping this downward revision trend.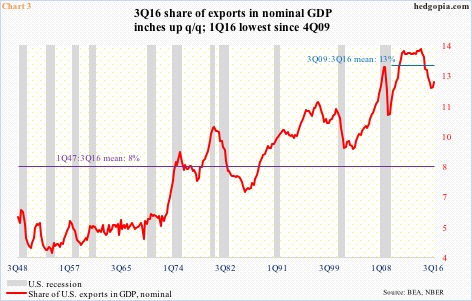
The U.S. economy is not as export-dependent as Germany or China. Nonetheless, at 12.2 percent in 3Q16, exports’ share of nominal GDP is decent. And it has grown over the decades. The 1Q47-3Q16 average is eight percent. This has grown to 13 percent post-Great Recession.
Here is the kicker. The red line in Chart 3 peaked in 2Q14 at 13.8 percent. Coincidentally, the US dollar index began to go parabolic in July that year (arrow in Chart 5). Exports’ share bottomed in 1Q16 at 11.9 percent. The dollar index suffered a sharp drop beginning January this year through the May bottom. Since the 1Q16 low, the red line has hooked up a tad. But with strength in the dollar index the past six months, it is anyone’s guess what that line would look like in the upcoming quarters.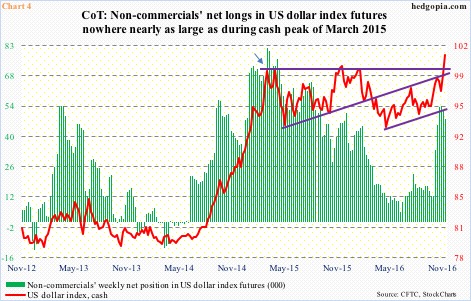
Hence the question once again, how long before we start hearing the adverse side effects of a strong greenback?
It is possible this is the reason why non-commercials are nowhere near as aggressive as they were during the March 2015 peak in the dollar index (arrow in Chart 4). Back then, they held north of 81,000 net longs in US dollar index futures. The November 2015 peak in the cash coincided with a lower peak in the green bars in Chart 4 (51,000 contracts). Most recently, holdings peaked in the week through November 1 at north of 54,000, even as the dollar index proceeded to break out.
In other words, the breakout in the cash has taken place without non-commercials fully jumping on the rally bandwagon. This can be viewed as a sign of strength. At the same time, the move post-Trump victory has been parabolic (Chart 1). Hard to sustain this kind of momentum – especially considering how overbought the cash is.
Separately, a strong dollar can potentially impact both aspects of the Fed’s dual mandate – by putting downward pressure on inflation and adversely impacting the economy through the exports channel. Jawboning is a tool central banks deploy often.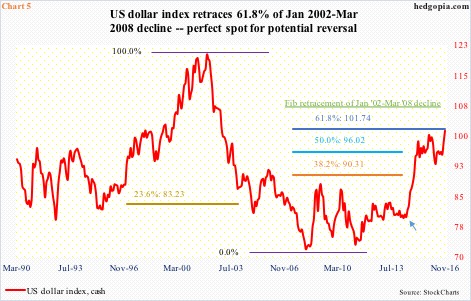
Amidst all this, it so happens that the dollar index has reached an important technical level.
On a monthly closing basis, it peaked in January 2002 at 120.24, then dropping to 71.802 by March 2008. A 61.8-percent retracement of that decline falls on 101.74 (Chart 5). The intra-day high last Friday was 101.54. For Fibonacci followers, this is an important retracement, and more often than not represents a level where momentum can reverse, or at least pause. (Using intra-day numbers, the dollar index peaked in July 2001 at 121.21 and bottomed at 71.33 in April 2008. A .618 retracement of that drop is 102.16.)
On particularly daily and weekly basis, the index is too extended, with the daily RSI 79.46 last Friday – has risen for 10 straight sessions.
Momentum is yet to break, and it may even rally a tad near term, but as things stand, it is probably safe to fade the move than jump on the bandwagon.
Thanks for reading!
