- Tremendous growth in student and auto loans (non-revolving) over the years
- First back-to-back drop in revolving consumer credit in February since June-July 12
- Consumers holding back, even as they are saving more – not enough juice for U.S. economy
The U.S. economy has become a bit of a head-scratcher.
Right here and now, it is sending the wrong vibes.
Economists have pretty much given up on 1Q15. Growth in real GDP is expected to come in at 1.4 percent – clear deceleration from 2.2 percent in 4Q and five percent in 3Q. Culprits cited range from the strong dollar to severe winter weather to the West Coast port strike.
If it is just the weather, then it is a matter of time before things start improving. Bad weather has had adverse impact in the past, but this is also something that should prove transient and will be shaken off in due course.
But is that the case now?
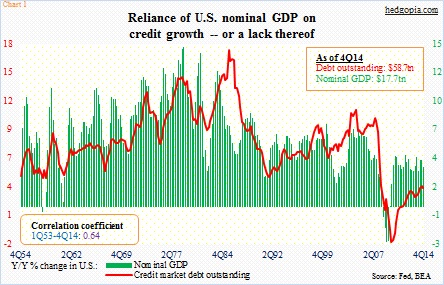
Credit has been a part and parcel of the U.S. economy. Chart 1 plots year-over-year percent change in U.S. nominal GDP and the total outstanding debt. They track each other well.
One constant in the game of leverage is that, as the debt pile grows, it increasingly needs more debt to get the same desired outcome. That is the nature of the beast. Back in the 80s, total debt outstanding was $4.4 trillion, and nominal GDP $2.8 trillion (1Q80); now (4Q14), they are $58.7 trillion and $17.7 trillion, respectively.
So any time there is a break in the flow of credit – regardless it is due to supply or demand – the economy will feel it.
In February, revolving consumer credit shrank $3.7 billion month-over-month. This was the second successive month of contraction. As can be seen in Chart 2, at least going back to the late ‘90s, outside of recession (or, coming out of recession), back-to-back decline in this category is not that common (indicated by blue arrows).
This could very well be one of those several instances when consumer credit dropped for a couple of months before coming back to life. After all, year-over-year growth is still positive, growing three percent in February; however, it is down from 3.7 percent growth in December. Once again, it shows deceleration.
We are witnessing this change in consumer behavior even as their savings rate has gone up in recent months (Chart 3). So it is a double whammy – consumers are less willing to charge their credit cards, even as they are saving more.
Last August, year-over-year growth in average hourly earnings of production and non-supervisory employees peaked at 2.48 percent. The savings rate in that month was 4.7 percent, already in deceleration from 5.1 percent in May-July. Hourly earnings continued its downward momentum, and consumers continued to dip into their savings. Until November when the savings rate bottomed at 4.4 percent. Since then, annual growth in earnings has decelerated further – to 1.76 percent in February – even as the savings rate has risen to 5.8 percent.
Nonetheless, consumers are not holding back across the board.
Yes, revolving credit is down. Non-revolving credit is a different story. In February, total consumer credit (seasonally adjusted) rose $15.5 billion, to $3.3 trillion; in January, it rose $10.8 billion. Of the $2.5 trillion in non-revolving credit in February, student loans were $1.3 trillion and motor vehicle loans $955 billion. This is where growth is, particularly student loans, which have gone up 138 percent in the last eight years. Auto loans have only been trending higher since 2010 (Chart 4).
This dichotomy is costing the U.S. economy dearly – one side of the consumer credit pie well-greased (excessively, in fact) and the other side stuck in the mud.

