
The 2Q17 earnings season gets underway in earnest this week.
S&P 500 companies are expected to earn $31 out of operations, which compares with $28.82 in 1Q17 and $25.70 in 2Q16. If earnings come in as expected, they would have grown sequentially for the second consecutive quarter. Will they?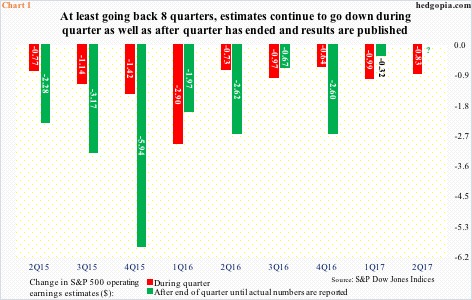
The revision trend is not good.
A year ago, these companies were expected to earn $32.66 in 2Q17. In fact, estimates went down by $0.83 in April-June alone, which is what the red bar in Chart 1 shows. The bars represent change in estimates during a quarter, while the green bars show change between the end of the quarter and publication of actual results.
For instance, 1Q17 estimates were $30.13 when the quarter began and $29.14 when it ended, for a difference of $0.99. When it was all said and done, $28.82 was earned, so estimates went down by another $0.32 after the quarter closed.
At least going back eight quarters, estimates have been revised downward not only during the three months of a quarter but also after the quarter ended, that is during the reporting season.
If this pattern holds, 2Q17 likely ends up earning less than $31. We will find out by the time final numbers are tallied.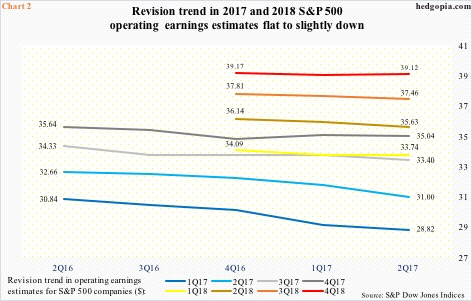
Estimates for the second half this year as well as next year likely meet the same fate, but are holding up thus far. In the past six months, 2018 estimates in particular have only inched slightly lower (Chart 2).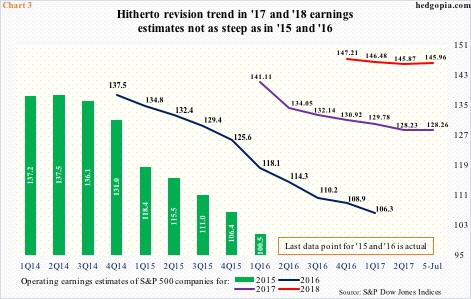
This phenomenon is better seen in Chart 3, which plots the revision trend going back to 2015.
Right off the bat, what jumps out in the chart is that the downward revision trend for 2017 and 2018 is not as steep as was the case in 2015 and 2016.
Estimates for 2015, for instance, were as elevated as $137.52 in 2Q14, versus $100.45 in actual earnings. Similarly, 2016 earned $106.26 – nowhere near $137.46 that was expected in February 2015.
From this perspective, the comparatively stable trend this year and next can be viewed two ways. (1) There is still plenty of time for the curve to steepen – on the downside, of course. This particularly holds true for 2018, as the year does not even begin for another six months – another nine months before we learn 1Q18 results. (2) There has indeed been a change in the revision trend.
As things stand, it is hard to wholeheartedly embrace (2), particularly when it comes to 2018.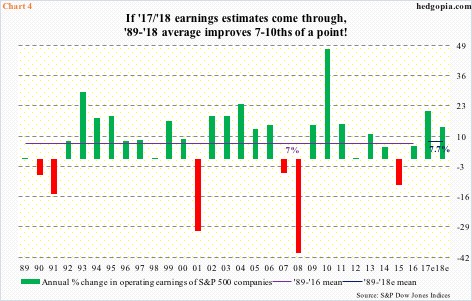
This much we know.
Current estimates have 2017 growing 20.7 percent and 2018 13.8 percent. The economy is in its ninth year of recovery. In the last eight years, earnings jumped nearly 115 percent from $49.51 in 2008, with only one down year (2015). The cycle is old.
Consider this.
Between 1989 and 2016, earnings grew at an average of seven percent each year. This jumps to 7.7 percent if 2017 and 2018 estimates come through – seven-tenths of an increase just by including two years in a population of 30 (Chart 4). That is the kind of growth expected of these two years.
Never say never, but elevated 2018 looks more like pie in the sky.
Thanks for reading! Please share!
