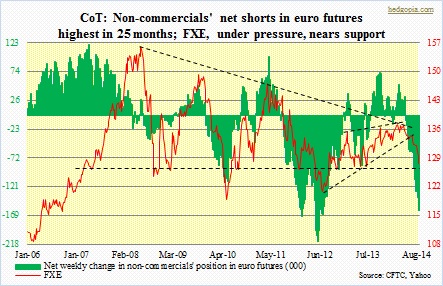
 As discussed last week that non-commercial futures traders might just once again be ahead of the curve in anticipating market reaction to Thursday’s ECB decision, they indeed were. By Tuesday (last week), they had raised net shorts in euro futures by 11k contracts, to a total of 161k. That was two days before the ECB decision. The day the ECB came out swinging with its rather unexpectedly dovish decision, the currency closed down 1.6 percent – a huge one-day move in the currency world. The central bank not only lowered its interest-rate targets – refinancing rate to 0.05 percent – but also pushed the rate on bank deposits further into negative territory – to -0.2 percent, and said it would purchase asset-backed securities, with more details to come in October. ECB chief Mario Draghi promised more, should the need be. We can argue whether a reduction from 0.15 percent to 0.05 percent in the euro-area lending rate can have any impact whatsoever on the already-fragile economy, but the move more than anything else is a symbolic one. Major central banks are in a race to devalue their currency. The Japanese yen weakened to a six-year low last week. German exporters must be clamoring for a weaker euro. From that perspective, the latest ECB act has achieved its goal – so far. Market participants have voted with their money, and they clearly expect the downward momentum in the euro continues. Large speculators in futures agree.
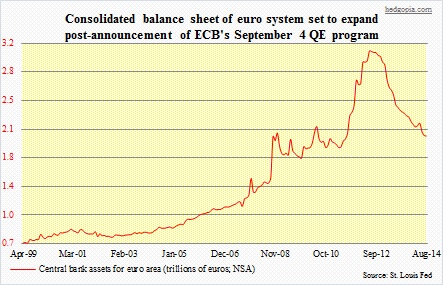
 As the chart above shows, the FXE (127.7) is approaching important support – between 126 and 127. Long-term technical indicators have been unwinding overbought conditions for six months now. The ETF peaked at 137.87 early March, and has a little bit more room left before it gets to oversold levels. In this respect, that support holds some meaning – as a way to measure bulls’ desire to step up in defense of that. And then there is this to all this. Unlike the Fed, the Bank of England and the Bank of Japan, the ECB has refrained from large-scale purchases of government bonds outright. ECB assets peaked in June 2012 at €3.1tn. They were at €1.4tn in September 2008 before surging. By June 2012, they had more than doubled, before, as the adjacent chart shows, embarking on a sustained move lower. Currently, they are at €2tn. In comparison, the Fed’s balance sheet expanded from under $500bn at the start of 2009 to over $4.1tn now. It was pretty much a lower left-to-upper right, straight-line move. As the Fed is winding down its purchases of Treasuries and mortgage-backed securities, the rate of growth of its balance sheet has decelerated, having expanded by $400bn year-to-date, versus by over $700bn in the same period last year. The ECB is going the other way. If the additional liquidity it is creating spurs risk-on behavior among foreign investors for European equities and bonds, then that has the potential to act as a tailwind for the euro, not exactly what Draghi is hoping for. There are simply too many crosscurrents in this currency-devaluation game. How traders react to the afore-mentioned support on the FXE should be a good tell-tale.

