
- Margin debt jumps $20bn in Feb to nearly match all-time high a year ago
- Interesting, tight correlation between margin debt and U.S. banks’ C&I loans
- Rise in inventories-to-sales ratio probably suggests imminent slowdown in C&I loans
NYSE margin debt shot up 4.5 percent month-over-month – $20.1 billion – to $464.9 billion in February. Depending on if this is one-off or there is more to come, this has obvious repercussions for stocks, and maybe even for U.S. banks’ commercial and industrial loans.
First off, was margin debt the reason why stocks did so well in February, with the S&P 500 large cap index rising 5.5 percent, the Nasdaq composite 7.1 percent, and the Russell 2000 small cap index 5.8 percent?
Margin debt now stands less than $1 billion from the all-time high of a year ago ($465.7 billion). It has essentially gone sideways for a year now.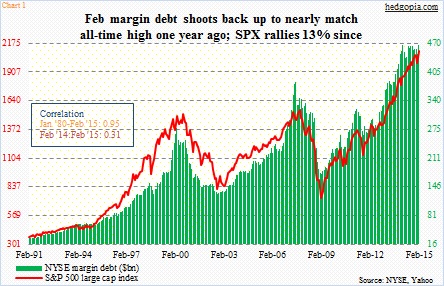
As Chart 1 shows, the S&P 500 and margin debt has a tight correlation – 0.95 going back to January 1980. But since it peaked in February last year, R has weakened, to a mere 0.31. In the 12 months since that peak, the index has gone on to rally 13 percent, which has weakened R.
The February snap back took many observers by surprise, including this blogger. So what are the odds that there are more surprises in store? The prior two peaks offer some possible reference points.
Back in 2007 for three consecutive months – April through June – margin debt grew $25 billion or more each month before peaking in July. Also in 1999-2000, in three out of four months beginning November, margin debt grew $20-billion-plus before peaking in March. So right before it flames out, persistent increase lasting a few months is always possible. If history is any guide, should that happen, that would probably not be the time to high five and backslap, rather pull in horns.
The difference between those two prior peaks and now is that back then once it peaked, there was not much sideways movement. This time around, there is. Unless of course the high is yet to come.
This can provide us clues as to what might lie ahead as relates to C&I loans. It turns out, the two series show strong correlation (Chart 2). Not sure why they correlate. May be because both portray borrowers’ desire to take on risk – one involves stocks, the other business. But R is tight – 0.95, since January 1980.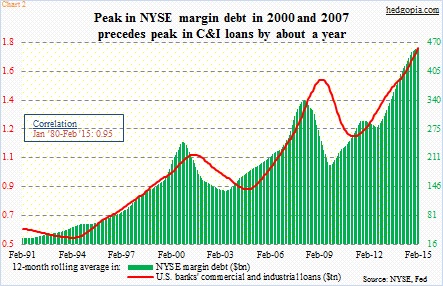
The chart uses 12-month rolling average for both series. During the last two peaks, margin debt has led C&I loans by about a year. As things stand now, the former peaked in December last year at $455.1 billion; nonetheless, since November, it has hovered in the $454-$455 billion range. Given strong February and depending on how March comes in, it is possible the green bars in Chart 2 have not peaked yet.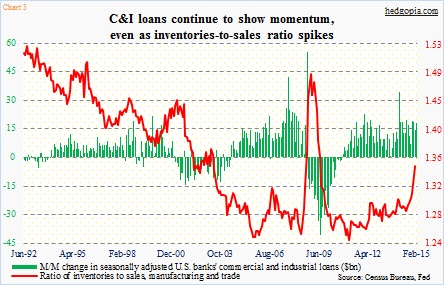
Under this scenario, the green bars on the right side of Chart 3 has potential to continue to come in strong. With some ups and downs, m/m change in C&I loans has remained healthy for a year now. The latest spike has come in the last four months. Businesses probably borrowed to stock up on inventories, which, however, are not moving as smoothly as they would like. U.S. economic activity decidedly shifted down in 1Q. Inventories are rising. Notice the sharp rise in the inventories-to-sales ratio (as of January). This has the potential to put downward pressure on C&I loans in outer months, which, if materializes, would suggest margin debt is close to peaking, if not already.
