
Orders for non-defense capital goods ex-aircraft – proxy for business capital expenditures – continue to lose momentum. Year-over-year growth dipped in the negative territory for the first time since January 2014. One month does not a trend make, but there is already a mini-trend in place. Orders have dropped for seven consecutive months. In March, they were $68.2 billion, versus $73.1 billion as early as last August. There is a good chance this continues.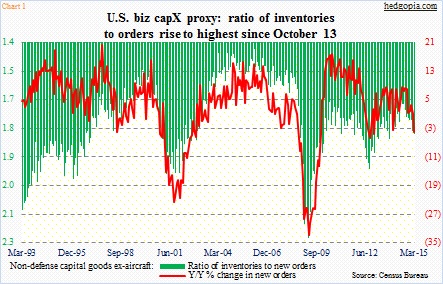
A year ago, orders increased from $67.8 billion to $71 billion, and for the most part have stayed in the $70-billion range since (except for $69.2 billion in May). Both February and March this year, they came in under $70 billion. So when April numbers come out, just to have flat growth year over year, orders need to grow three percent over March. This by no means is outside the realm of possibility. But there is another trend that is not very encouraging.
The inventories-to-orders ratio continues to inch up (green bars in Chart 1). The 1.8 reading was the highest since October 2013.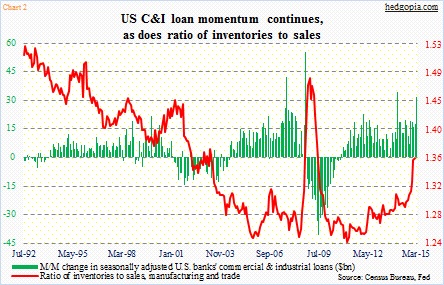
This, by the way, fits with what is going on in other areas of the economy. Look at the spike in the red line in Chart 2. It is a ratio of inventories to sales in manufacturing and trade. The February reading of 1.363 was the highest since June 2009. Makes one wonder if all the healthy increase in commercial & industrial loans over the past several months has now resulted in bloated inventories, and is now hurting orders.
