The US Economy is humming along, as was evident in several data points this week. Small-caps, which have larger exposure to the domestic economy versus their larger-cap cousins, bounced off of months-long rectangle support. But they are well off their record highs and remain range-bound, even as large-caps are at/near new highs.

Several important macro data were published this week. The final 3Q21 print showed real GDP grew 2.3 percent, revised higher from the prior 2.1 percent. That said, this was the slowest growth rate in seven quarters. Growth is in deceleration mode after favorably responding to trillions of dollars in monetary and fiscal stimulus, which is now wearing off.
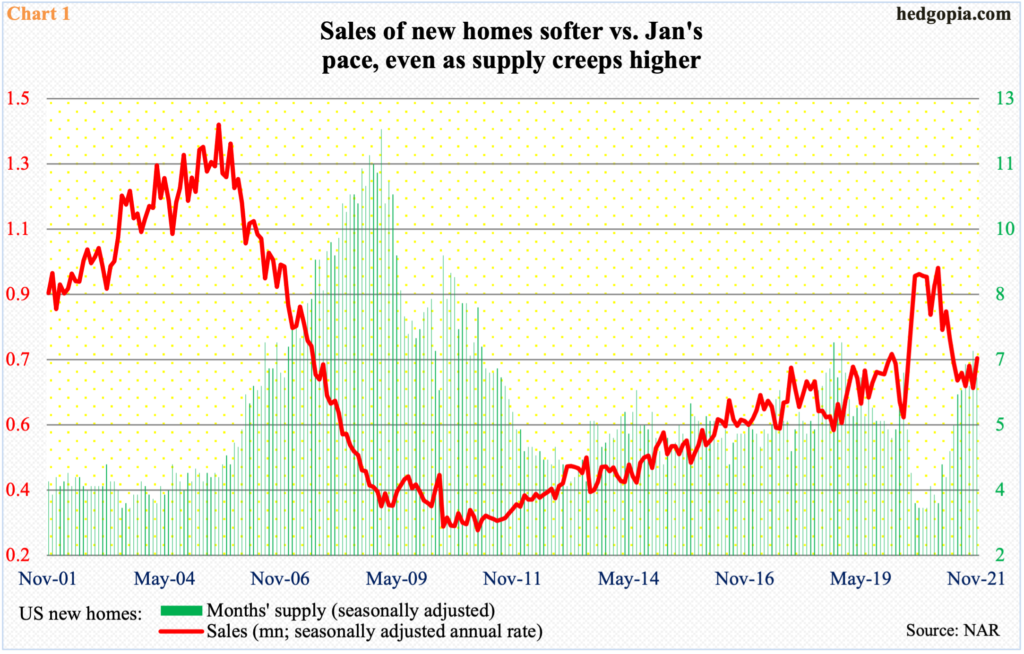
Similarly, new home sales jumped 12.4 percent month-over-month in November to a seasonally adjusted annual rate of 744,000 units. This was a seven-month high. Sales have softened since hitting 993,000 in January this year.
More importantly, supply is steadily creeping higher. In August through October last year, months’ supply dropped to 3.5; this October, it rose as high as 7.1, before dropping slightly to 6.5 in November (Chart 1).
Prices are through the roof, with the median price in November at record $416,900. This has to price out an increasing number of potential buyers.

If new home sales give us an opportunity to peer into what is transpiring in the household sector, durable goods help shed light on the business sector.
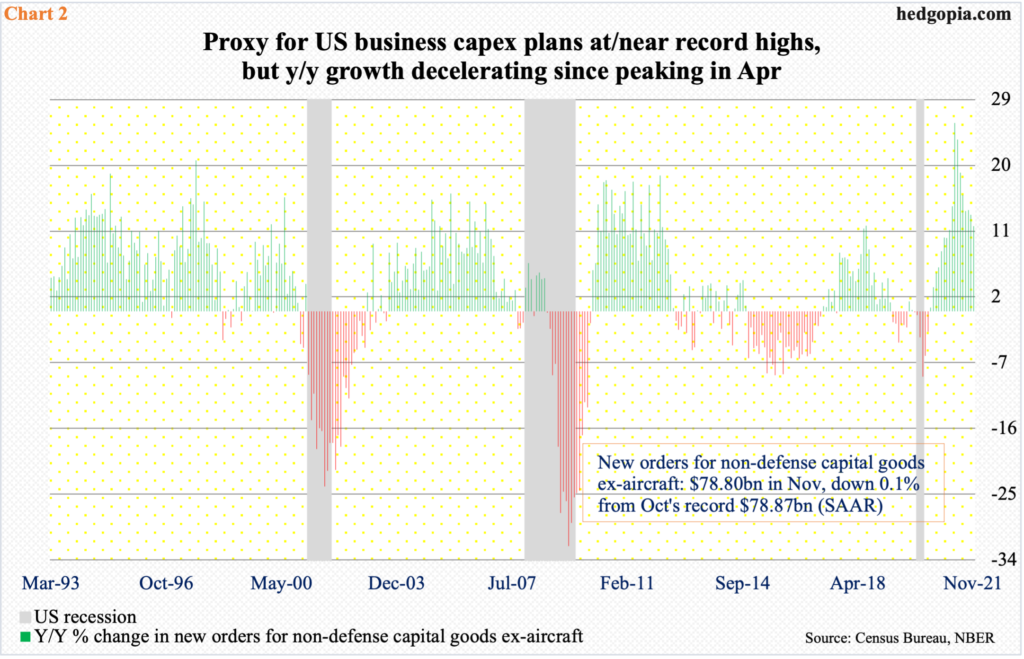
New orders for non-defense capital goods ex-aircraft, which is a proxy for business plans for capital expenditures, increased 11.7 percent year-over-year and fell 0.1 percent m/m in November to $78.8 billion; October’s $78.9 billion was a record. Earlier in April last year, the metric hit $59.9 billion.
November’s y/y pace represents very healthy growth, except growth has softened big time since registering 25.9 percent in April this year (Chart 2).
Once again, the message is the same. Growth is decelerating from a heady pace, which was simply unsustainable to keep up.
The question is, what will the future bring? Will growth continue to decelerate, especially considering that the Federal Reserve is tapering its bond purchases and is set to raise rates in the first half next year. Or, will growth stabilize at a lower level? There is confusion all around. And it is reflected in how small-caps are trading.

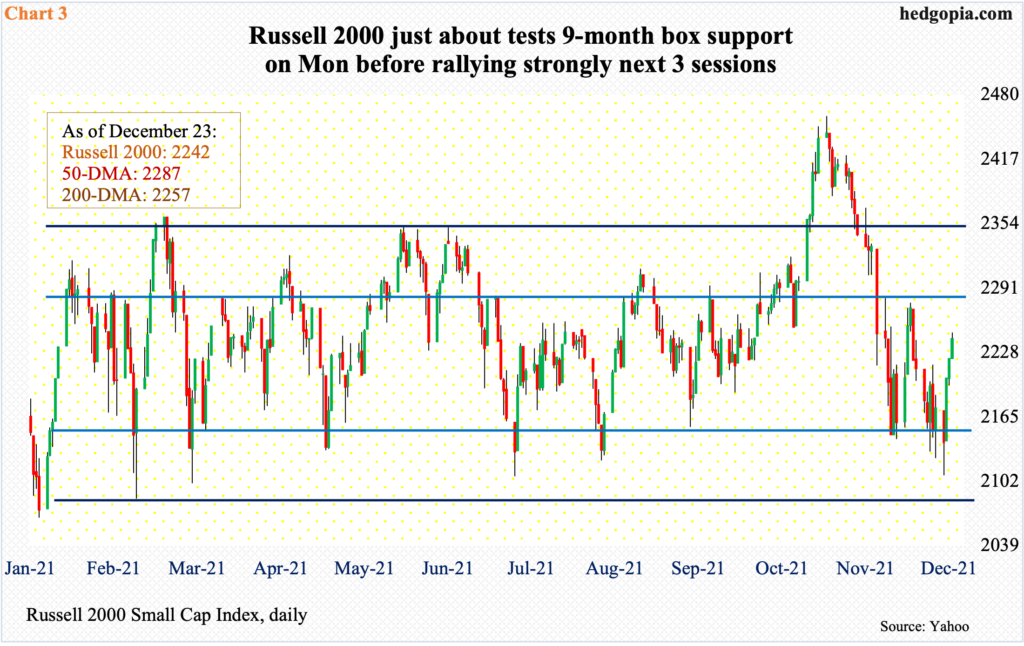
For over nine months now, the Russell 2000 has been rangebound between 2350s and 2080s, and between 2280s and 2150s within this rectangle. On Nov 3, the small cap index broke out but was quickly followed by a failed retest on the 19th.
On Monday, the lower support was just about tested as the index dropped to 2108, which drew bids. This was then followed by rallies in the subsequent three sessions (Chart 3). It closed Thursday at 2242, just under straight-line resistance at 2250s. A bigger test lies at 2280s, and not to mention 2350s.
Interestingly, the Russell 2000, which is home to companies with larger exposure to the domestic economy, is well off its record high, even as the S&P 500, which hosts the 500 leading companies and is also exposed internationally, is at/near its all-time high. If the Russell 2000 is sending the right message, then the US economy is probably in for serious deceleration ahead, which would seriously raise question marks over next year’s optimism around earnings.
Thanks for reading!

