US equity indices have had massive gains in the past four months. In the options market, calls heavily outweigh puts – to a point where it is beginning to look dangerously lop-sided. If past is prologue, during such times it pays to take out the caution hat.

The rally since the March lows has produced phenomenal gains for the longs. Through yesterday’s intraday high, the S&P 500 large cap index was up 49.5 percent. Through last week’s high, the Nasdaq 100 index surged 63.5 percent, and the Russell 2000 small cap index jumped 59.1 percent through its high early June.
These are out-of-this-world gains in as short a time as four months! A lot of the time, it can act as a self-fulfilling prophecy. What is transpiring in the options market is an example. For several weeks now, it has paid to be greedy, which encourages more risk-taking activity. Greed begets more greed – so to speak – until gravity rules and momentum reverses.
Risks are elevated, to a point where things are looking frothy.
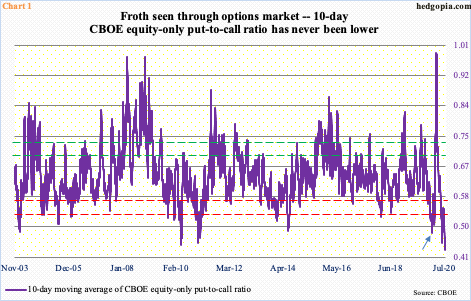
On Tuesday, the CBOE equity-only put-to-call ratio printed 0.39 – the second 0.30s reading in five sessions and fifth in 34; the 21-day moving average came in at 0.478 and the 10-day at 0.430, with the former lowest since April 2010 and the latter at a new record (data goes back to October 2003).
For reference, leading up to the February-March collapse in US stocks, the 10-day dropped to 0.480 on January 17 (arrow in Chart 1), and 0.501 on February 19 when the S&P 500, and other major equity indices, peaked. Greed was rampant back then. This needed to get unwound and unwind it did in quite a fashion. By March 19, the ratio surged to 0.989. Fear had replaced greed. The S&P 500 bottomed on the 23rd.
Once again, the pendulum has swung heavily to the greed side.
Unless one is extremely nimble and has the skill set to maneuver around potential pitfalls, these are not the times to be gloating over trades that worked rather avoiding those that will not.

When sentiment is this lop-sided, it does not take much before the pendulum swings the other way. In January-February this year, when sentiment was as effusive, it was the coronavirus that came out of left field.
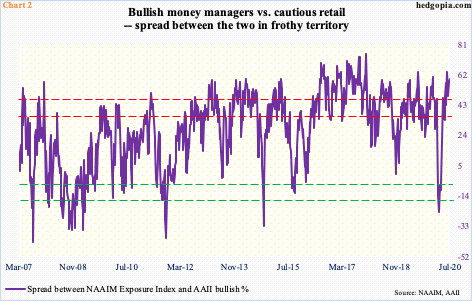
Back then, in the week to January 9, the spread between the NAAIM Exposure Index and AAII (American Association of Individual Investors) bullish percent was at 61.1 – a 24-week high. This was well into elated territory. The subsequent unwinding culminated in a reading of minus 23.7 in the week to March 18. Greed quickly gave way to fear.
Last week, the NAAIM reading, which represents National Association of Active Investment Managers members’ average exposure to US equity markets, rose 5.4 points week-over-week to 90.5; AAII bullish percent rose 3.7 percentage points to 30.8 percent. The resulting spread of 59.7 was at a four-week high (Chart 2). The prior high of 63.9 in the week to June 17 was at a 47-week high.
In past is prologue, whenever the spread between the two enters extended territory – either up or down – it pays to play contrarian, which is clearly the case now. Using these two metrics in particular, professional are way too bullish, retail not so much. When that has happened, it has paid off to play cautious.
Thanks for reading!

