It is probable US households’ equity allocation set a new high last quarter. Stocks have relentlessly rallied for over five months – without so much of a correction. With investor sentiment looking frothy, bulls are increasingly running out of tailwinds to continue to push equities higher.

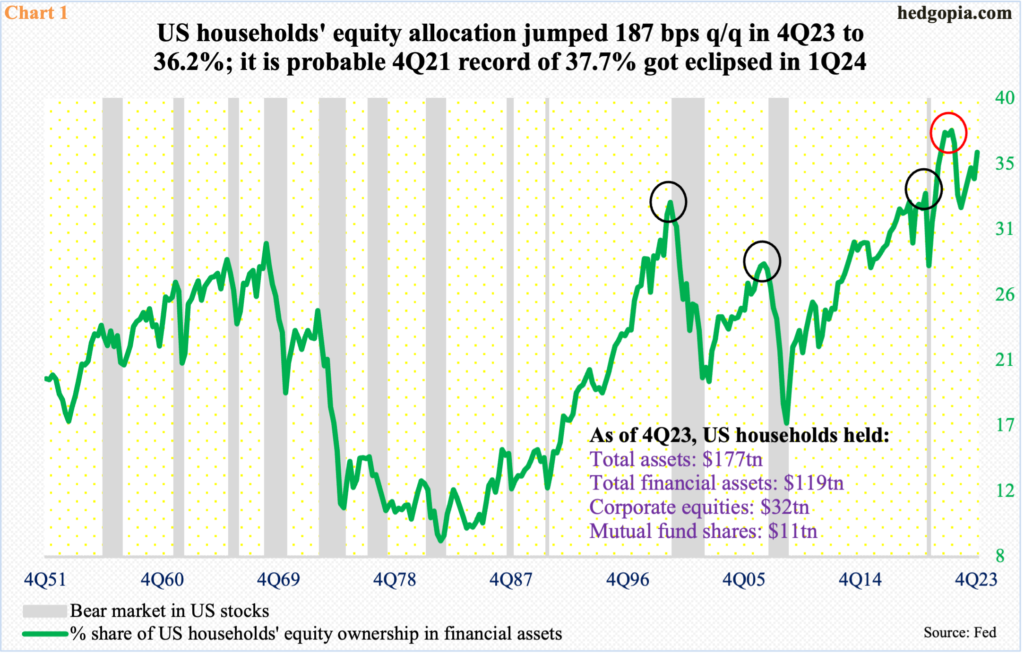
In the December quarter, US households’ equity allocation jumped 1.87 percentage points sequentially to 36.2 percent (Chart 1). This was the largest quarter-over-quarter increase in three years. The all-time high of 37.7 percent was set in 4Q21 – just before the S&P 500 peaked at 4819 in January 2022; the index did not bottom until hitting 3491 in October that year.
It is probable the equity allocation set a fresh record in the March quarter. This series is contained in the Federal Reserve’s Z.1 report, which is published with a rather long lag. Numbers for the last quarter were released about a month ago, with the March quarter on schedule for early June.
The large cap index jumped 11.2 percent in 4Q23 and another 10.2 percent in 1Q24. The market capitalization of S&P 500 companies expanded by $4.1 trillion in the December quarter and by another $4 trillion in the March quarter. This should be enough to push the equity allocation past the 37.7 percent record. It is worth reviewing how investor sentiment behaved back then.

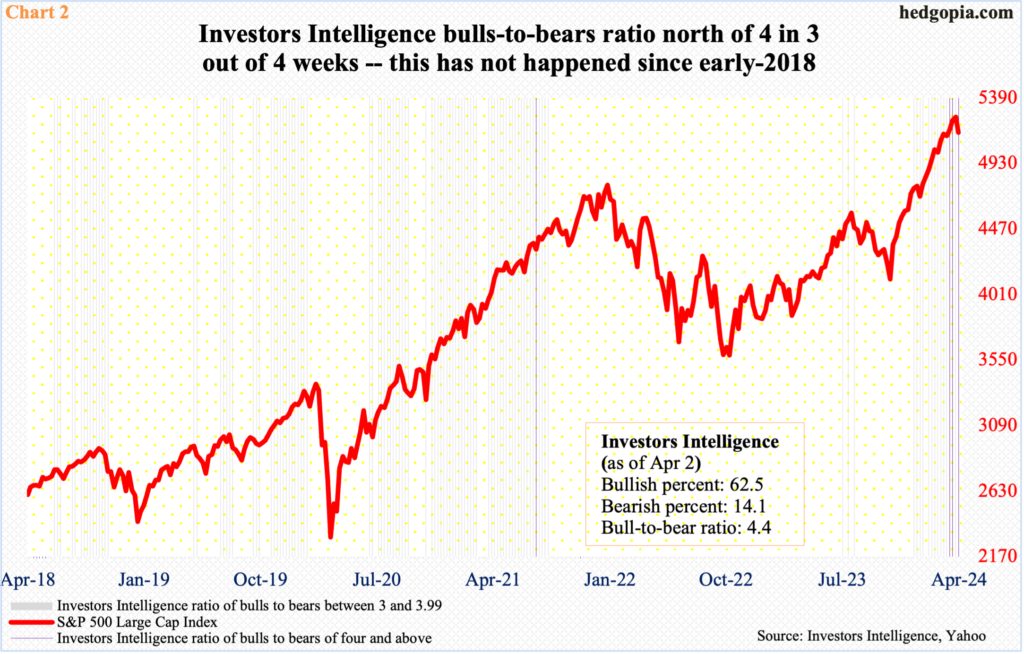
This week (as of Tuesday), Investors Intelligence bulls increased 1.9 percentage points week-over-week to 62.5 percent, while bears slid 1.1 percentage points to 14.1 percent. This respectively was the highest since April 2021 and the lowest since January 2018. The bulls-to-bears ratio printed 4.4. In three of the last four weeks, the ratio crossed four, with the prior week (the week to March 26th), coming in at 3.99, which is essentially four (Chart 2).
This was also the fourth week in a row the bullish percent remained north of 60 percent. The last time this sentiment was as elevated was the latter months of 2020 and early 2021. Back then, for 10 consecutive weeks between November 2020 and January 2021, bulls’ count remained north of 60 percent, with the bulls-to-bears ratio well north of three percent. This bullishness got hardly unwound in 2021, as, between January and July, there were 10 weeks of bulls over 60 percent. The S&P 500 suffered a minor drop in January but went on to rally in nine of the next 11 months to finish 2021 up 26.9 percent. This was when the equity allocation jumped to 37.7 percent. And this is what ultimately gave way to the 2022 collapse in stocks.

From just the sentiment perspective, it is hard to tell if the bullish boat is leaning to one side enough to capsize right away. Just going by the Investors Intelligence survey, and if past is prologue, there is room for sentiment to continue higher before it hits a tipping point. At the same time, households’ equity allocation is dangerously close to a bubble territory.
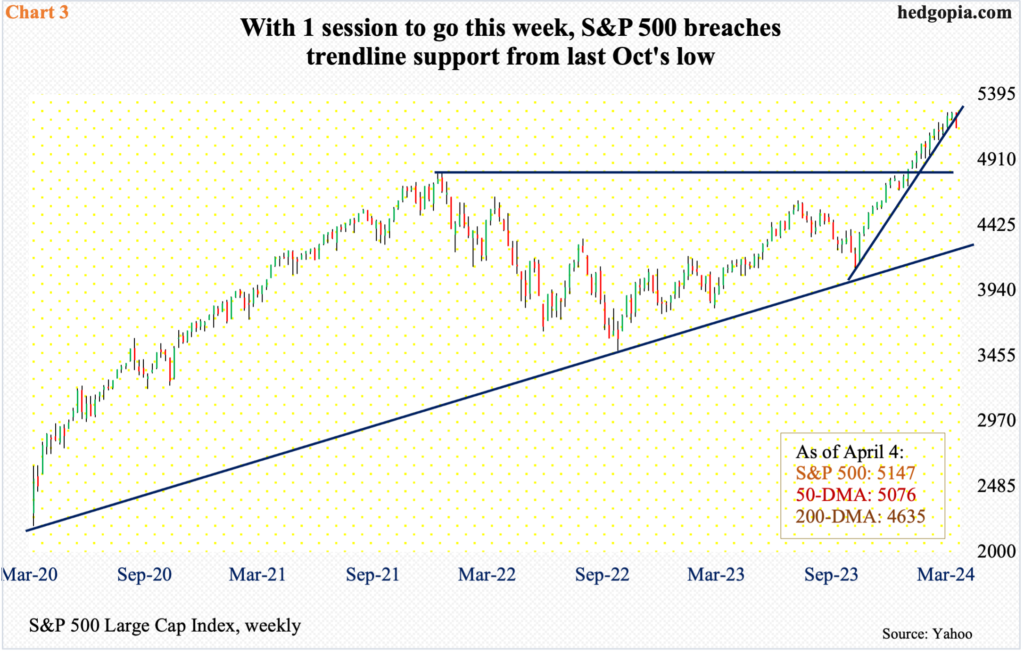
Just since the October low, the S&P 500 rallied north of 28 percent before selling off a tad this week, and this creates a situation in which it is tempting to lock in gains – at least some. For that to occur, and for stops to get taken out, the technically-oriented ones in particular are keenly watching some levels.
With one session to go, the S&P 500, down two percent this week to 5147, is now in breach of a rising trend line from last October’s low (Chart 3). A similar trend line on the Nasdaq 100 was compromised three weeks ago. Thursday’s 1.2-percent decline resulted in the S&P 500 also losing shorter-term moving averages, with the bulls unable to defend 5170s and also not able to push through 5260s. The index peaked at 5265 on March 28th.
Ironically, Thursday’s selloff was blamed – wrongly – on hawkish interest-rate comments from Neel Kashkari, Minneapolis Fed president. First, he has been hawkish for a while now. Second, he is not a voting member this year. This is an extended market looking for a reason to sell off, and there is a long way to go before the currently soapy sentiment is unwound.
Thanks for reading!

