
- 2007/2008 crisis fueled by excessive use of leverage
- Not much learned from that experience as U.S. debt continues to balloon
- Consistently falling trading volume can create problem even as primary market has gotten bigger
As the chart below shows, we as a nation and as a system have failed to learn anything out of the financial crisis six years ago. Not to sound redundant, but debt was at the root of the problem back then. And not much has been done to treat that disease, let alone cure. Since 2007, U.S. outstanding debt has gone up from $31.7tn to $38.1tn (as of 2Q14). Of the seven categories, ‘treasury’ and ‘corporate debt’ have contributed the most to this debt revelry, with the former having gone from $4.5tn in 2007 to $12.1tn and the latter from $5.2tn to $7.7tn! 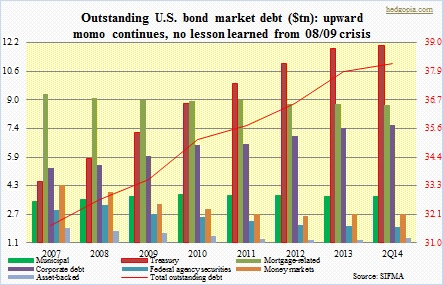
Post-Great Recession, the U.S. ran a budget deficit of $1tn-plus for five straight years from 2008 to 2012; 2013 deficit was barely under $1tn. These deficits were behind that spike in Treasury debt. The U.S. debt is nearly $18tn. Of this, ‘intra-governmental holdings’ is over $5tn, and a little under $13tn in what is categorized as ‘debt held by the public’. As the nation ran one after another year of deficit, the Fed started its QE program, at times buying a significant majority of the new issuance. Even as the Fed can be blamed for “monetizing” this debt, it can be argued that at the beginning there were no other alternatives than to run deficits. Ideally, after things stabilized, attempts should have been made to address the debt situation. None were made. 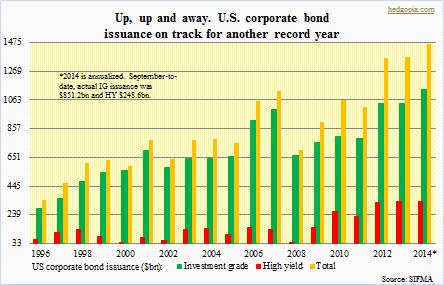
The lack of discipline was even more evident on the corporate side. As the GDP struggled to really take off, top-line growth was sorely missing. Enter financial engineering. Corporate boards heavily leaned on stock buybacks to shore up earnings per share. Debt was heavily relied on. Year 2014 is on track to becoming another record issuance in corporate bonds – five consecutive years of $1tn-plus. Yes, corporate cash pile has gotten healthier, and corporations also – probably rightly – took advantage of the low interest rates. But capital spending never increased commensurate with the rise in leverage. A lack of investment in capital now can affect productivity/ability to generate healthy cash flow later.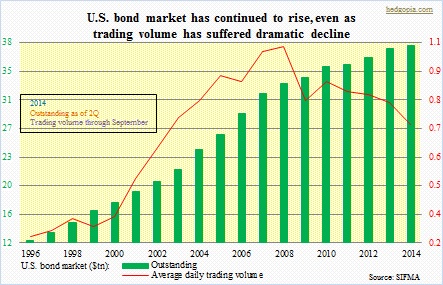
Interestingly, the record issuance in the primary market has come in the midst of a shrinking secondary market. The chart above shows consistently rising green bars, although average daily trading volume peaked in 2008 and has fallen since. As yields fall and bond prices rise, longs have reason to stay put. Default rates are low as well. This is probably creating a sense of stability. As well, repo trading volumes are low. The Fed is sitting on tons of treasuries, and there is a lack of good collateral. Nevertheless, illiquidity comes with a cost. We had a glimpse into this last Wednesday when a frenzied, volatile session had the 10-year – even the 10-year, a “risk-free” asset – trade in a 30-bps intra-day swing. Forget how bonds high on the risk spectrum will be treated during times of stress. A lot of these risky varieties have been gobbled up during this risk-on phase. Risk aversion will not be pretty.
