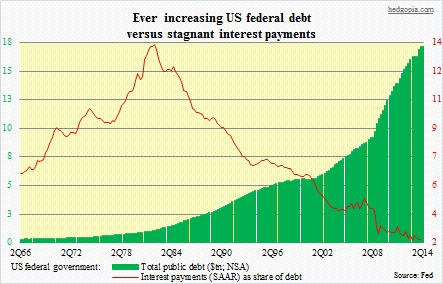
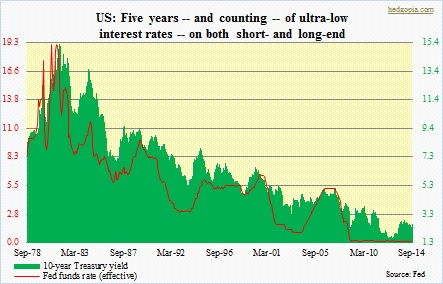
 As we await the FOMC statement this afternoon, the adjacent chart is apropos. In it, US federal debt has been plotted against interest payments (seasonally adjusted annual rates) of the federal government. The latter is calculated as a share of debt. Parabolic is how we can describe the debt buildup. In the last seven years, federal debt has essentially doubled, to $17.6tn. In the meantime, interest payments have gone sideways, give or take – $430bn in 2Q07, versus $417bn in 1Q14. Back then, interest payments made up 4.8 percent of the debt load; in 1Q14, this was cut in half, to 2.4 percent. Hence the downward-sloping red line in the chart. To be clear, as the chart below shows, rates have been in a secular decline since they peaked in the early ‘80s. The Fed funds rate peaked at 19.1 percent in June 1981, followed by the 10-year which peaked yielding 15.3 percent in September of that year. Ever since, rates have moved from upper left to lower right. In view of this, it only makes sense that interest payments are lower. Well, yes and no.
 While true that the secular decline in rates acts as a tailwind for interest payments, there is another – and an important – variable to the equation. Rates are artificially suppressed. Pre-Great Recession, the Fed funds rate peaked at 5.3 percent in July 2007, and the 10-year yield a month earlier at 5.1 percent. Visualize the inverted yield curve, by the way. The Fed then nervously starts to lower Fed funds, and the 10-year follows suit. Fast forward seven years, the US economy is in its sixth year of recovery, and short-term rates continue to remain zero-bound. The 10-year, having earlier dipped all the way down to 1.4 percent in July 2012, remains well bid up. Owing primarily to the Fed’s quantitative easing, it has consistently found it tough to crack the three-percent mark for over three years now. Economic growth is sub-par, which argues for lower yields. But we also have a situation in which short-term funding costs nothing on an inflation-adjusted basis. This in an economy growing (on a real basis) in the two-percent range! Does not make much sense, at least on the surface. One look at that debt pile, and it all begins to make sense.
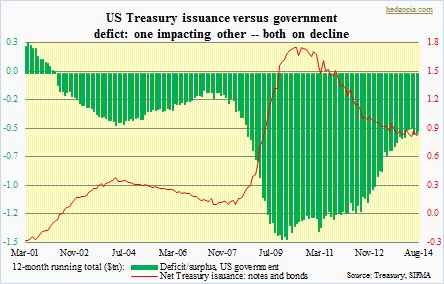
 For five consecutive years beginning 2008, the nation ran a trillion-dollar-plus deficit, with 2009 and 2010 just under $2tn and 2013 barely under $1tn. This year is relatively better – if it can be called that – with deficit the first eight months of a tad over $400bn. All this, of course, needs financing. From $4.5tn in 2007, US Treasury securities outstanding has surged to $12.3tn as of August this year. Any time you have interest-paying liabilities on the ledger, the lower the interest rates the better. Simple mathematics. Just for the sake of argument, let us make some assumptions. Once again, right before the onset of the Recession, the 10-year was yielding 5.1 percent. Five years on, real GDP is higher versus back then. We have recuperated all the jobs lost, and then some. Corporate profits are higher. And on and on. Simplistically, let us assume the long end of the curve begins to rise, and the effective rate the federal government pays on interest payments rises by a mere 100 basis points. We are talking an additional $180bn in interest payments. If rates go up by 200 basis points, we are looking at $354bn – this is in addition to what the government already pays in interest. Can we afford that? Nope. In this scenario, the government will have to either cut services and/or raise taxes and/or borrow more. To get some perspective, real GDP grew by $341bn in the entire 2013, to $15.7tn. This is the severity of the debt problem. The Fed will do its best not to let rates rise in a manner in which interest payments begin to suffocate the economy. Plain and simple. Low rates are here to stay, like it or not.

