
Four and counting! That is the number of consecutive quarters S&P 500 companies have spent in dividends and buybacks more than they took in operating earnings.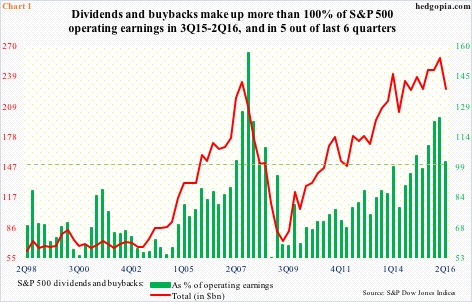
In 2Q16, these companies earned $222.8 billion out of operations, and doled out $98.3 billion in dividends and $127.5 billion in buybacks. The combined total of $225.8 billion makes up 101.4 percent of operating earnings (Chart 1).
In 2007/2008, the green bars in Chart 1 similarly stayed above 100 percent for six consecutive quarters before crashing. This time around, spending in dividends and buybacks has exceeded operating earnings in five out of the last six quarters. Not sustainable!
If there is any consolation in this, it is that the 2Q16 pace decelerated from 123.5 percent in 1Q16. The deceleration was due to both operating earnings rising and the combined total of dividends and buybacks dropping.
Operating earnings were $209 billion in 1Q16. More importantly, 2Q16 dividends rose a tad from $96.7 billion in 1Q16; buybacks, however, dropped 21 percent quarter-over-quarter.
Therein lies the rub.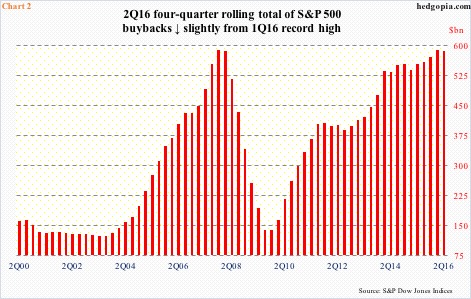
At $161.4 billion, 1Q16 buybacks were huge. In fact, they were the second highest ever after $171.9 billion in 3Q07. So it is possible corporations decided to take a breather in 2Q16. Further, even though 2Q16 saw a sequential drop of 21 percent, on a rolling four-quarter basis, it was merely $4 billion less than 1Q16 – $585.35 billion versus $589.41 billion, which was a record (Chart 2). It is always possible things pick back up in 3Q16. But is it probable?
More pertinent is this. Because the S&P 500 large cap index has continued to rise, it will increasingly take larger buybacks to have the same impact on the share count – hence on the bottom line – as it did in the past.
This is where Chart 1 comes in, as companies are already spending beyond their means. Not to mention decelerating earnings. Operating earnings of S&P 500 companies peaked at $262.9 billion in 3Q14, dropping to $202 billion by 4Q15. As stated earlier, 2Q16 was $222.8 billion (Chart 3).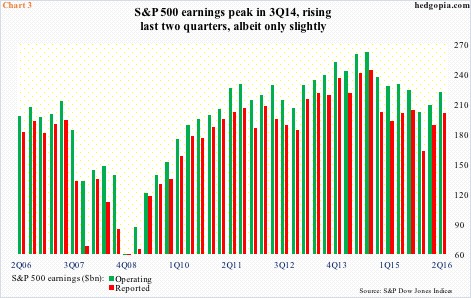
Put it all together, and this much is clear. It at least gets difficult for these companies to continuously increase their buyback plans. This is what sets in motion a process – process of decelerating buybacks.
Thanks for reading!
