Amidst new highs in major US equity indices, two important data points came out Monday – one positive, one not so.
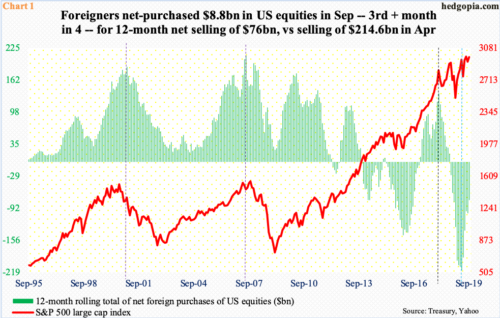
Foreign buying – or a lack thereof – is an important component in US stocks. A relationship between the two can be seen in Chart 1, which uses a 12-month rolling total. Violet vertical dashed lines highlight peaks in 2000 and 2007.
This time around, foreign buying peaked at $135.6 billion in January last year, which is when the S&P 500 large cap index suffered a sharp, two-week correction (black line). Since then, the index went through several ups and downs, but foreigners kept reducing their exposure to US stocks. By September last year, they had switched from net buying to net selling. In the 12 months to April, selling peaked at $214.6 billion (blue line). At minus $76 billion in September, they were still selling, but the trend continued to improve, purchasing $8.8 billion worth in the month – third positive month in four.
Bulls must find the prevailing trend encouraging.
Elsewhere, the news is not as good.
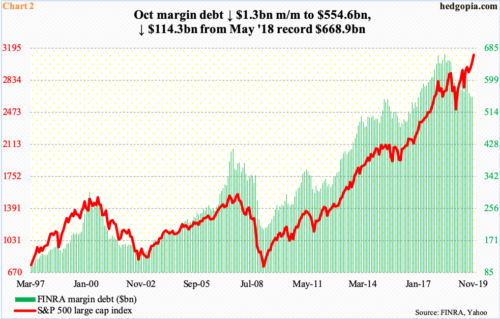
FINRA margin debt in October fell $1.3 billion month-over-month to $554.6 billion. Most recently, it peaked at $602.1 billion in July. In fact, the all-time high of $668.9 billion was recorded as far back as May last year (Chart 2). In the next 17 months through October this year, the S&P 500 jumped north of 12 percent. Clearly, the two have diverged. Stocks are making new – and newer – highs, but investors are not in a mood to take on new debt.
November-to-date, the S&P 500 is up another 2.8 percent. It will be another month before this month’s data is published, but how margin debt behaves in the month can be telling. In both 2000 and 2007, margin debt either coincided or led the peak in the S&P 500. In the current cycle, the divergence has gone on for too long. Corporate buybacks as well as the recent improvement in foreigners’ buying pattern has offset this, but the longer the two go the opposite way, the higher the odds stocks eventually catch up with margin debt.
Thanks for reading!

