
The Treasury’s Treasury International Capital System data contain a treasure trove of useful information as relates to flows of money into and out of the U.S for purchases and sales of U.S. securities.
On this post, we will deal with a few that probably have the most implications for U.S. assets at the present time.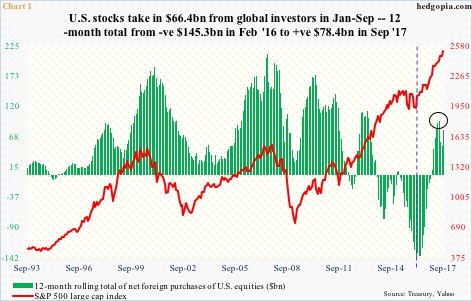
In September, foreigners purchased $26.3 billion in U.S. equities, more than eclipsing $17.5 billion in selling in the prior three months.
Year-to-September, purchases were $66.4 billion – healthy, but with slight deceleration. In June this year, the 12-month rolling total of purchases were $94.3 billion. In September, they were $78.4 billion.
This data point has implications for U.S. stocks, as the red line in Chart 1 has shown a tendency to move with the green bars.
Of note, back in February last year, foreigners were selling $145.3 billion worth, before reversing (dashed vertical line). The S&P 500 large cap index reached a major bottom in that month.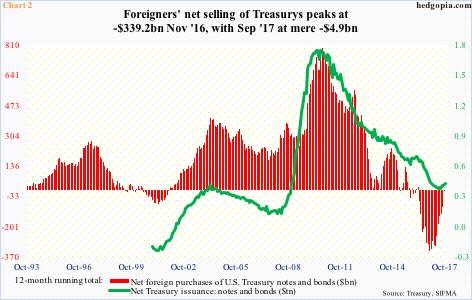
A similar relationship is evident in Chart 2.
The red bars represent the 12-month rolling total of foreigners’ net purchases of U.S. Treasury notes and bonds, the green line net issuance of notes and bonds by the Treasury.
In May 2010, Treasury issuance peaked at $1.7 trillion. Shortly thereafter, in September that year, foreigners’ purchases peaked at $793.3 billion.
The green line in the chart kept declining until this July when the 12-month running total bottomed at $335.1 billion. Foreigners, in fact, had been net sellers for a while. On a 12-month rolling total basis, they have been selling since April 2016, although this peaked at $339.2 billion last November, with September at merely -$4.9 billion – nearly flat.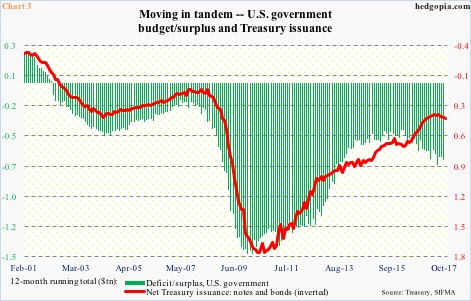
This is important as the U.S. government is beginning to run up deficit.
On a 12-month running total basis, September deficit came in at $665.7 billion, up substantially from $403.6 billion in January last year. Treasury issuance (notes and bonds), in the meantime, went from a low of $335 billion in July this year to $380 billion in October (Chart 3).
The green bars in the chart are going the wrong direction, with the red line in tow. Foreigners thus need to step up.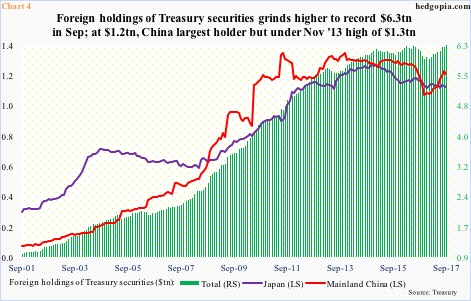
In September, foreign holdings of Treasury securities – not just notes and bonds but also bills – rose $53.7 billion month-over-month to $6.32 trillion. The green bars in Chart 4 have gradually risen since bottoming at $5.95 trillion in January this year, but have essentially been flat to slightly up for a while. In January 2015, foreigners held $6.22 trillion.
China and Japan continue to be the two largest holders – at $1.18 trillion and $1.1 trillion, respectively. In this respect, both these nations are off their respective highs – $1.32 trillion in November 2013 and $1.24 trillion in November 2014, in that order.
China’s in particular needs watching. In November last year, holdings dropped to as low as $1.05 trillion, briefly losing the largest holder title to Japan. Its foreign exchange reserves were under pressure back then, as it was having to defend the currency. In January this year, China’s reserves dipped slightly under $3 trillion. They obviously sold some Treasurys. At the end of October, reserves stood at $3.11 trillion, even as Treasury holdings have gone up.
As things stand, the green bars in both Charts 1 and 4 are headed the right direction, but probably not enough to act as major tailwinds for U.S. stocks and Treasurys at this point in time.
Thanks for reading!
