
On a 12-month basis, foreigners’ purchases of US equities dropped slightly in July, with June the highest since April 2010. If this represents a turn in their sentiment, this will have come at a time when buybacks are no longer a tailwind and the S&P 500 just got rejected at a crucial technical level.
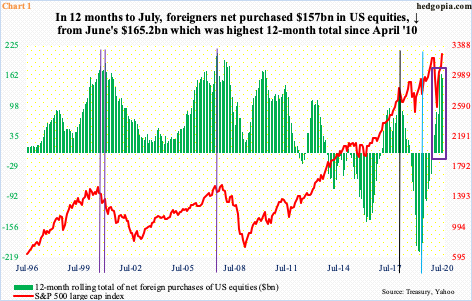
On a 12-month basis, foreigners’ net purchases of US equities turned positive last December. That was just before severe selling in February and March. Throughout that selloff, foreigners kept adding, and have now been rewarded.
The S&P 500 large cap index eclipsed its February high of 3393.52 in the middle of August, before rallying all the way to 3588.11 on the 2nd this month. From March’s low to the high early this month, it jumped nearly 64 percent.
In the 12 months to June, foreigners purchased $165.2 billion in US equities, which was the most amount since April 2010. In July, the pace of buying decelerated to $157 billion. The question is, does this represent the beginning of a reversal?
Historically, the S&P 500 and foreigners’ purchases – or a lack thereof – have tended to go hand in hand (Chart 1).
If foreigners are indeed pulling back their horns, this would have come at a time when US corporate buybacks are turning into a headwind as well.
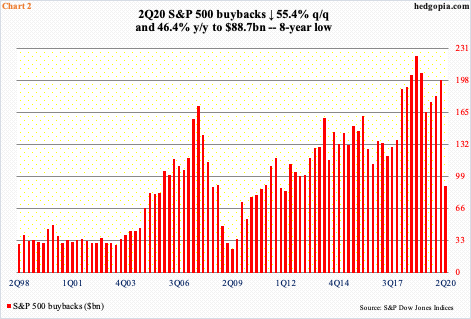
S&P 500 companies spent $88.7 billion in buybacks in 2Q20 – an eight-year low (Chart 2). This is down 55.4 percent from the previous quarter and 46.4 percent from four quarters ago. In 4Q18, these companies bought back a record $223 billion worth.
On a four-quarter basis, $644.9 billion was spent in 2Q20, which pales in comparison to the record $823.2 billion spent in 1Q19 but remains massive; spending was healthy in the prior three quarters.
In 2Q20, buybacks made up 40.1 percent of $221.1 billion in operating earnings. Throw in another $119 billion in dividends, not much is left. These companies are swallowing more than they can chew. Given a choice, corporate boards would not want to touch dividends unless they must. Buybacks are vulnerable, and it is beginning to show in the data.
Stocks are also not getting a lot of help from money market funds.
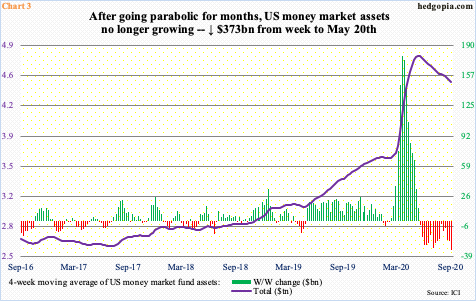
In the week ended February 19, just before major US equity indices collapsed, money market funds held $3.63 trillion. In the next five weeks, this rose to $4.22 trillion. Indices bottomed on March 23, but these funds kept growing, reaching $4.79 trillion in the week to May 20. The parabolic rise followed by the recent contraction is seen in Chart 3, which uses a four-week moving average.
Since the May high, $373 billion has come out of these funds, but stocks are not getting their fair share. Lipper data show that between the week to May 20 and Wednesday this week, $74.6 billion left US-based stock funds.
All this is taking place even as the S&P 500 has reached a crucial juncture.
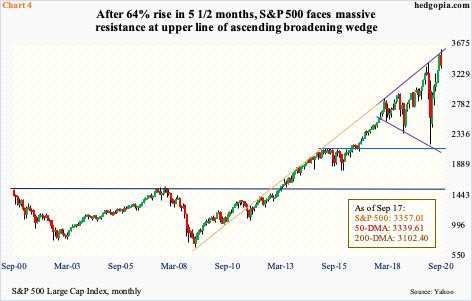
When the index bottomed on March 23, the low came right on the lower line of an ascending broadening wedge, which also approximated five-year horizontal support (Chart 4).
Early this month, the index got rejected at the upper line of the wedge. This is coming at a time when the index (3357.01) remains overbought on both the weekly and monthly.
Currently, bulls and bears are locked in a tug of war around the 50-day moving average. Once this decisively gives way, momentum likely shift bears’ way – timing and duration notwithstanding. This can influence how foreigners behave.
Thanks for reading!
