
Spot gold potentially had an important session on Tuesday. Since the May 2nd high of $1,306/ounce through Tuesday’s hammer low, the metal gave back eight percent, in the process losing its now-declining 50-day moving average.
The Tuesday low likely came on important support.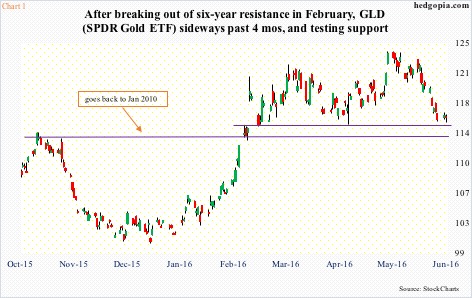
On February 11th, gold closed up 4.1 percent (up 5.6 percent intra-day), breaking out of $1,180 resistance. U.S. stocks bottomed in that session. Since then, the metal has pretty much been range-bound. The low end of that range – around $1,200 – was defended on Tuesday. The corresponding support on GLD, the SPDR gold ETF, lies around $115 (Chart 1).
Gold’s/GLD’s daily technicals are grossly oversold, so a rally can ensue – especially so if the metal gets continued support from the following two groups.
Money has been moving into gold ETFs this year, with GLD attracting $4.8 billion through Tuesday, and $2.8 billion beginning February 10th (courtesy of ETF.com). Once again, the ETF has essentially gone sideways since the latter date. These longs have seen their investments flattish to slightly down the past four months.
Rather encouragingly for gold bugs, since May 2nd, when gold began to come under pressure, through Tuesday, GLD attracted $2.7 billion. Longs are not panicking. Now that gold/GLD is on support, they will be sending a strong message if the ETF begins to witness fresh inflows.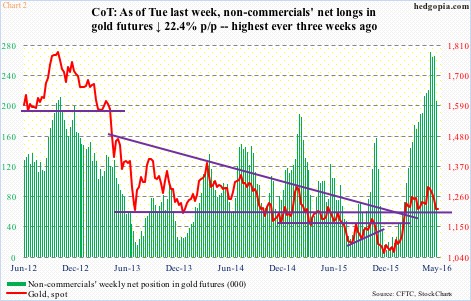
Non-commercial futures traders are the same way. As early as the week to December 1st last year, they had cut back net longs in gold futures to below 10,000 contracts. Then gold bottoms. These traders begin adding to net longs – all the way to the all-time high 271,648 contracts by May 3rd (Chart 2).
Since that peak, non-commercials’ holdings have gone down by 24 percent, but remain sizable. Gold has not made much headway the past four months, and if this is what is leading these traders to cut back, whether or not the metal holds current support will be important.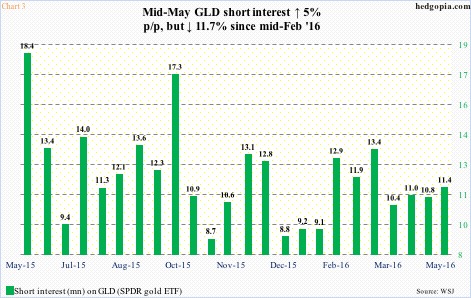
But assuming the afore-mentioned support holds, non-commercials stop unwinding net longs, and flows continue into GLD, there is room for a mini squeeze. Short interest on GLD rose five percent in the May 13th period, and up north of nine percent since the end of March. This is not major accumulation, but short interest is up nicely from January this year (Chart 3).
Should a rally ensue, it is too early to say if gold finally breaks out of the four-month range.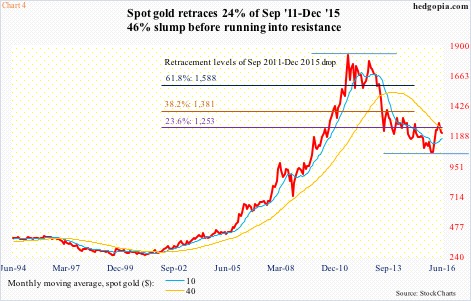
It is worth noticing that the metal’s five-month rally into the May 2nd high stopped after retracing 23.6 percent of the September 2011-December 2105 decline. This is a Fibonacci number, and watched closely by so-inclined technicians. In fact, as pointed out earlier, gold rallied to $1,306 on May 2nd, surpassing the 23.6-percent retracement (Chart 4).
During all this, gold’s 10-month moving average has hooked up. This is another encouraging sign for gold bugs – provided of course the four-month support holds. In the event that this gives away, there is another right underneath. This one goes back six years – $1,180 on spot gold ($1,215.2) and $114-114.50 on GLD ($115.94), give and take (Chart 1).
Given the significance of this support zone, it is probably not irrational to assume that this does not get violated – at least not yet. In this scenario, a cash-secured put can be deployed with a goal of going long, if the need be, at a lower price – near the afore-mentioned support.
June 10th weekly GLD 115.50 puts fetch $0.85. If assigned, the cost of the underlying drops to $114.65. Else, it is a nice premium to keep.
Game changes if gold/GLD loses support. Monthly indicators are indeed beginning to hook down from overbought levels, hence worth watching.
Thanks for reading!
