
Once again, spot gold ($1,305.60/ounce) is testing crucial support. The US dollar can help, at least near term.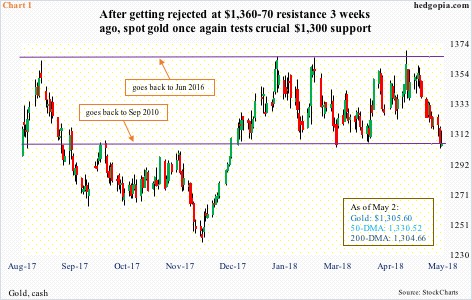
The yellow metal has pretty much been range-bound for two years now – between $1,300 and $1,360-70. Most recently, the upper bound was tested on April 11. Subsequently, it lost the 50-day moving average, on its way to testing the lower bound, which now also approximates the 200-day (Chart 1).
Tuesday, gold fell to $1,302.30 intraday. Wednesday, it essentially closed on the 200-day. A rising trend line from December 2016 rests here as well (Chart 2).
Support at $1,300 goes back to at least September 2010. In a worse-case scenario, even if this level is lost, gold bugs can step up to defend trend-line support around $1,285 from December 2015. That is when gold bottomed at $1,045.40 after peaking in September 2011 at $1,923.70. This is a must-hold.
Amidst this range-bound action, gold bugs are doing all they can. Since April 11, when gold retreated, through this Tuesday, GLD (SPDR gold ETF) took in $295 million, and IAU (iShares gold trust) $401 million (courtesy of ETF.com). The drop in the metal seemingly is being used as an opportunity to go long. Going back all the way to January 25, when gold tested and failed at the above resistance, they respectively attracted $774 million and $1.4 billion.
The question is, will inflows continue if $1,300 is lost? Similar dynamics may be in play elsewhere.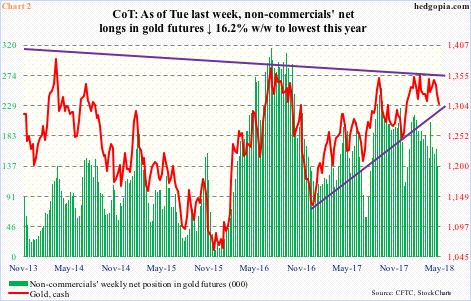
Non-commercials have been cutting back net longs in gold futures since their holdings peaked at 214,684 contracts in the week to January 23 this year (Chart 2). (Once again, two days later, gold was rejected at the upper end of its range.)
In the week through Tuesday last week, net longs fell another 16.2 percent week-over-week. These traders need to stop selling.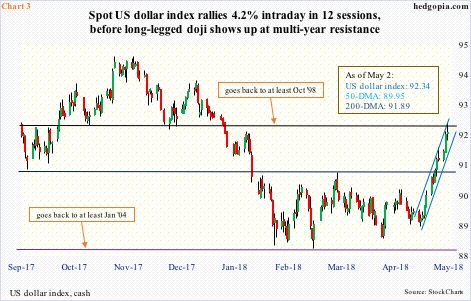
Enter the US dollar.
On April 11 (that is when gold’s most recent drop began), the US dollar index fell intraday to 89.02. This level was undercut slightly four sessions later when it fell to 88.94 on the 17th, right before just about going parabolic. Between that low and the intraday high Wednesday, it rallied 4.2 percent!
This move precedes persistent defense of long-term support at 88-89 (Chart 3). The 50-day has been taken out, as is the 200-day – the latter this Tuesday. The cash has momentum. Near-term, though, the daily chart is extended, with Wednesday producing a long-legged doji right on long-term resistance; 92-93 has proven to be an important level going back to at least October 1998.
As things stand, this is gold’s best hope for now. That the US dollar index begins to unwind its overbought condition, and the metal begins to attract bids.
Thanks for reading!
