
- Soft fundamentals, but gold continues to hold up well
- Large speculators added further to their net longs in gold futures
- Overbought near-term, but potential weakness likely gets bought near support
Trend followers do what they do best. Large speculators are latching on to the recent trend of rising gold price. Last week, they added more to their net longs in gold futures, by both cutting shorts and raising longs for a net change of 25k contracts. The past two weeks, their net longs have gone up by 39k. Gold bugs should like this. One look at Chart 1 and it is easy to see how gold and non-commercials’ position tend to move hand in hand. As things stand now, gold needs all the help it can.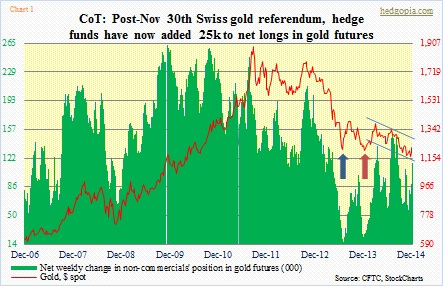
After the metal peaked at 1,924/ounce in September 2011, it suffered a nasty three-year drop. Until November when it stopped going down. It is too soon to say if it is a lasting bottom. Maybe, maybe not. In June last year (blue arrow in Chart 1), gold stabilized and rallied 16 percent in two months, before the downtrend reasserted itself. Again in December last year (brown arrow), it rallied 18 percent in three months, but that was not to last either. This time around, gold has rallied eight percent so far. Which probably means: (1) even if the downtrend is still alive and well, there is room for more price appreciation, and/or (2) if the bear is not dead yet, it is just a matter of time before the prior trend reasserts itself.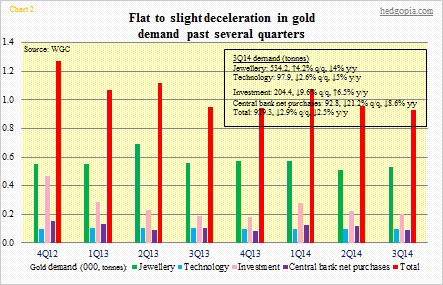
One of the things that led to the abrupt reversal in the price of gold three years ago was how the crowd first bought into the mania and then how quickly it turned tail. At one time – we are talking August 2011 – GLD (gold) surpassed SPY (S&P 500) as the largest ETF in terms of assets. The sense of fear was so great among people, it was palpable. Then someone turned that switch off. Like that. A month later, gold peaked. And the rest is history. Today, GLD has $27bn in assets, SPY $200bn. Since 4Q12, of the four main categories for gold demand (Chart 2), ‘investment’ has been more than cut in half. The remaining three are more or less flattish to slightly down. And that has been the difference in gold demand in 3Q14 versus what was back in 4Q12.
Any chance the public fascination of the yellow metal reignites? Well, the last time U.S. Treasury debt got downgraded was back in August 2011. There are no budget crises in Washington, as lawmakers keep kicking the can down the road. The euro is alive and well. Post-financial crisis, there was a large swath of people who believed the world was staring in the eyes of calamity. But we survived. The funny thing is, all these issues have the potential to come up on investors’ radar screen again. It is just a matter of when. If it is not now, then it is all good. At least, that is the common perception. And in this environment, gold ends up with fewer fans.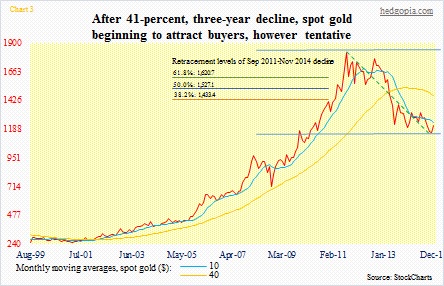
It is probably not an exaggeration to say that right here and now fundamental drivers are lacking. Yes, of course, we hear of countries seeking to repatriate their gold home – from Germany to the Netherlands to Belgium to now Austria; heck, Switzerland even had a referendum on this very issue. But we also have a situation in which gold has failed to rally on the face of crazy central-bank printing. So what do we do at a time like this? Turn to technicals, of course. On that front, the metal is holding up well.
There have been two distinct positives of late: (1) the metal is above the crucial 1,180 level, and (2) it broke out of the July downtrend line. To boot, it is above its 50-day moving average, which is no longer dropping but flattish to slightly rising. In the right circumstances, gold has a lot to catch up with. If we do a simple Fibonacci retracement calculation of the September 2001-November 2014 decline, even the 38.2-percent level lies at 1,433 (Chart 3). That is a long, long way from here.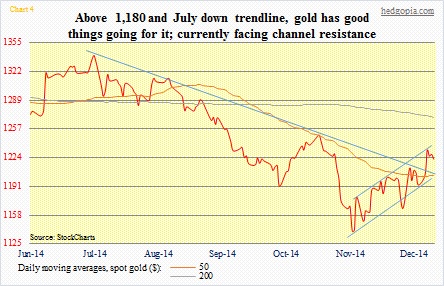
Right now, these are the issues gold faces. On its way down, the metal broke many supports. So as the price rises, supply will be heavy around those levels. How the metal holds up to that supply will decide where it goes next.
In the best-case scenario, gold (1,222.10) has a shot at 1,260-1,270. That is where the March trendline meets (Chart 1), as well as the 200-day moving average (Chart 4). Before that happens, gold has to overcome another hurdle. It is overbought near-term. The metal has carved out a nice ascending channel for itself since early November (Chart 4). As long as it is in it, it is all good. The low end of that also corresponds to the 50-day moving average. That is a natural place for new bids to show up.
