
Gold shows nice price action, just broke past $1,300/ounce, and has room to rally further, particularly if non-commercial futures traders continue to keep the faith and/or the U.S. dollar weakens further.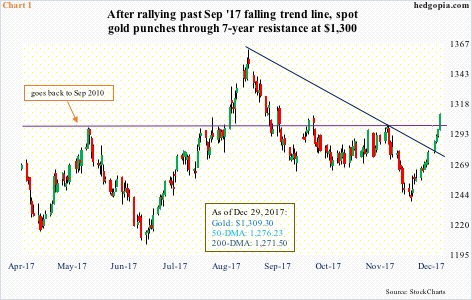
Most recently, the yellow metal bottomed at $1,238.30 on December 12, and has since rallied in 11 of the last 12 sessions – up 5.8 percent.
The weekly chart has room to continue higher. The daily chart is extended, having closed well outside the daily upper Bollinger band last Friday.
Importantly from gold bugs’ perspective, $1,300 got taken care of. This resistance goes back seven years. In 2017 alone, this level repelled rally attempts several times. There was a breakout in August, but that turned out to be false (Chart 1).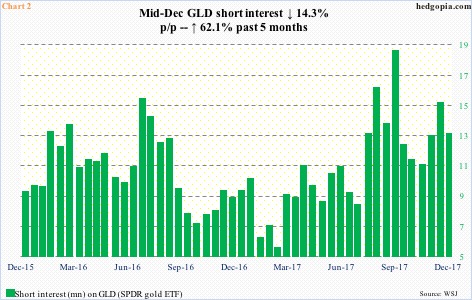
Short interest on GLD (SPDR gold ETF) likely lent a helping hand during the most recent advance.
By the end of November, GLD short interest had risen to a two-month high of 14.9 million. In the next period – that is, mid-December – it dropped 14.3 percent to 12.8 million. This makes up merely 4.5 percent of the shares outstanding, but only five months ago short interest had dropped to 7.8 million.
In the right circumstances, the green bars in Chart 2 can shrink. Given the rally in GLD/gold in the second half last month, that may have already occurred. We will find out when end-December numbers are reported on the 10th this month.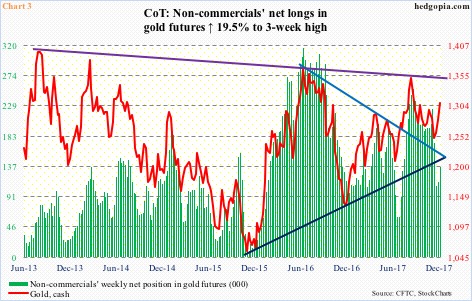
The December 12th bottom in gold coincided with a bottom in non-commercials’ net longs in gold futures.
In the week ended December 12, their net longs troughed at a 20-week low of 107,068 contracts, rising to 135,948 as of last Tuesday. As early as the week ended September 12 last year, they were holding 254,760 contracts. There is room to rise.
Also seasonally, this tends to be a favorable period for gold. In fact, this very fact may have led these traders to begin to add to net longs.
As things stand, the cash remains comfortably above all major moving averages. The shorter-term averages in particular are rising. The bulls have the momentum. The only question is if the metal is better off unwinding some of the daily overbought condition it is in, followed by defense of support. There is a confluence of moving-average support at the $1,260-$1,270 level.
Alternatively, gold continues higher – toward a slightly falling trend line from August 2013 (Chart 3). In this scenario, the September 8th high of $1362.40 gets tested.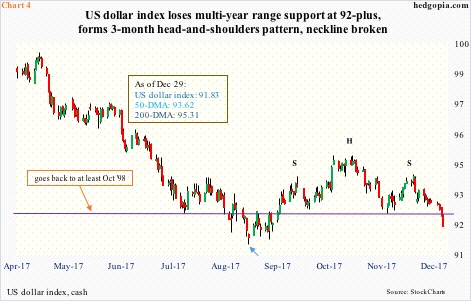
The U.S. dollar can play a role in this regard.
After peaking in January last year at 103.82, the US dollar index bottomed on September 8 at 90.99 (blue arrow in Chart 4). The subsequent rally stopped at 95.07 in early November. Since that high, the index has made lower highs and lower lows.
Last Friday, it sliced right through important support. Since March 2015, the dollar index pretty much played ping pong between 92-93 on the bottom and 100-101 on the top. That support, which goes back nearly two decades, is now gone.
Plus, there was also a three-month head-and-shoulders formation in play, the neckline of which approximated that range support. Completion of this pattern ensures a move below 90. Should this unfold, the dollar index could very well be headed toward testing the September 8th low.
In this scenario, the weekly chart of gold prevails over the daily.
Thanks for reading!
