Gold has regained its shine. Sort of. In the past three months, the metal has rallied 23 percent. At the same time, it is running into important resistance, including Fibonacci and eight-year horizontal. The metal likely takes a breather near term. The three-month rally had full cooperation from non-commercials and ETF flows. They will thus play a crucial role in if the impending weakness gets treated as an opportunity to add or prune.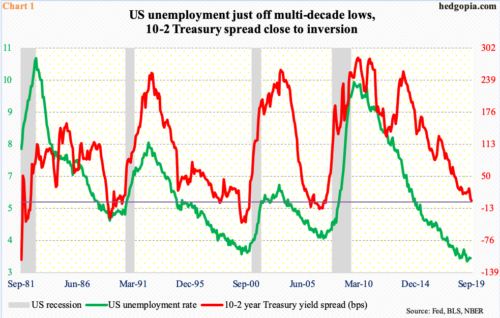
The US economy added less-than-expected 130,000 non-farm jobs in August, for a monthly average this year of 158,000, which is a lot weaker than last year’s monthly average of 223,000. The unemployment rate edged lower month-over-month to 3.69 percent in August, a bit higher than April’s 3.58 percent, which was the lowest since December 1969.
Good times do not last forever. As Chart 1 shows, the unemployment rate is notoriously cyclical. The only direction to go from these multi-decade lows is up. It is just a matter of when, not if. A sustained move higher precedes contraction in the economy. The sovereign bond market is signaling as much.
In three straight sessions in late August, the yield spread between 10- and two-year Treasury notes inverted. In fact, several other portions of the yield curve have remained inverted for several months now, including the one between 10-year notes and three-month bills. If past is prologue, this precedes recession.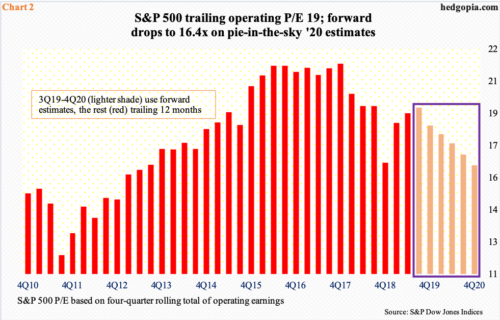
Equities beg to differ from the bond market. Except for mid- and small-caps, major US equity indices indexed to large-caps are within striking distance of their late-July highs. Trailing multiples understandably are elevated, with an operating P/E of 19 for S&P 500 companies at the end of June. This improves on a forward basis – 16.4x on 2020 estimates – but it is hard to trust next year’s estimates.
The sell-side routinely starts out optimistic and gradually brings estimates down as the year progresses. With two quarters in the bag, the blended estimates for this year were $161.96 last Thursday; in August last year, these bottom-up analysts expected $177.13. Things evolved similarly last year; up until November, $158.26 was expected, versus actual earnings of $151.60 when it was all said and done. Next year, $186.36 was expected in March this year. This has now been lowered to $181.42 but considering that the economy just completed a decade of recovery/expansion, it is difficult to take these estimates at face value. The risk at this point in the cycle is that bond vigilantes, who more often than not tend to get it right, are reading the tea leaves right.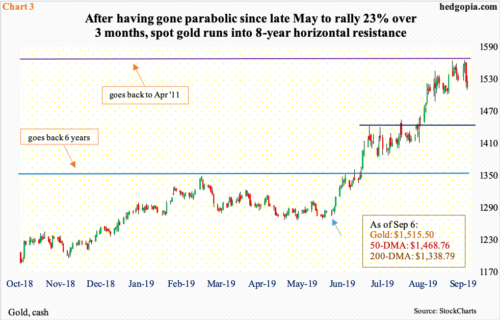
Safe-haven assets like sovereign bonds are rallying. We can also throw gold into the mix. From the US-China trade war to deceleration in the global economy to several geo-political hot spots, there is no shortage of issues for worry-warts to dwell on. To be fair, these issues have been around for a while. Thus, it is possible gold is sensing more than what is visible out there. It has absolutely gone parabolic the past three months, having rallied 23 percent between late May (blue arrow in Chart 3) and early this month. In the process, it scored some important breakouts.
Resistance at $1,340s-50s goes back six years. This gave way mid-June. Then late July, gold bugs took care of resistance at $1,440s-50s. The metal sits comfortably above both the 50- and 200-day moving averages.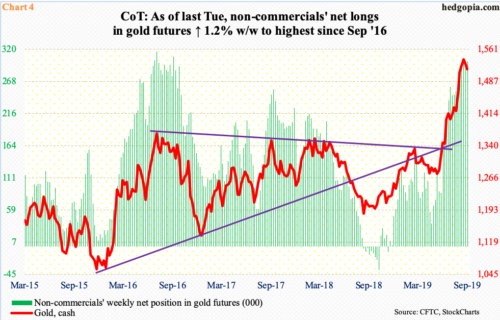
Gold’s advance in the cash market has full cooperation from non-commercials in the futures market. Toward the end of April, they were net long 37,395 contracts in gold futures. By Tuesday last week, this had grown to 300,547 contracts – a three-year high (Chart 4). Back then, these traders stayed with their neck-deep net longs for several weeks before beginning to cut back. Gold followed, or maybe it was the other way around.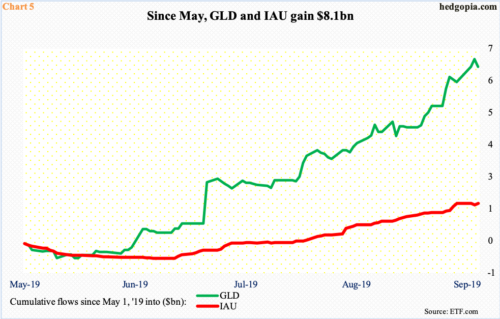
The rally since May has also elicited attractive flows into gold-focused ETFs. From May through last Thursday, GLD (SPDR Gold ETF) and IAU (iShares Gold Trust) combined took in $8.1 billion, with the former alone gaining $6.6 billion (Chart 5).
Here is the rub in all this. In the past month, the ETFs took in $3.4 billion. Gold during that period essentially went sideways (Chart 3). These new longs better not be a fickle bunch, as the metal acts like it wants to go lower for now.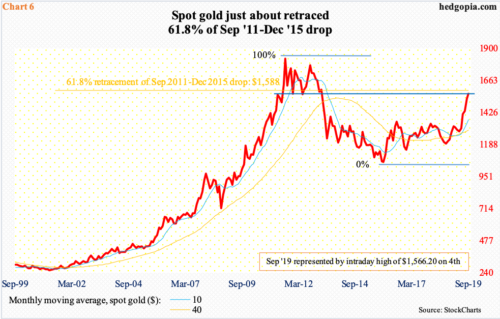
Gold is in overbought territory on nearly all timeframe. This in and of itself does not mean it has to begin unwinding right away. Overbought can remain that way longer than one can imagine. Here is the thing, though.
In September 2011, the metal peaked at an intraday high of $1,923.70 – a record – and began to unravel after it lost $1,540s-50s (Chart 6). It eventually bottomed in December 2015 at $1,045.40. A 61.8-percent retracement of this decline lies at $1,588. Fibonacci followers pay close attention to this retracement. In the current context, this level can act as resistance. Last Wednesday, gold tagged $1,566.20 intraday, ending the week at $1,515.50.
Immediately ahead, there is short-term support around $1,500, which approximates the daily lower Bollinger band, followed by previously mentioned decent support at $1,440s-50s (Chart 3). Then, there is important breakout retest at $1,340s-50s. A test of the latter looks unlikely for now. Even if gold were to test $1,440s-50s, it is possible this gets treated as an opportunity to open new longs or add to existing ones. In this scenario, how non-commercials and ETF flows behave will be an important tell.
Thanks for reading!

