
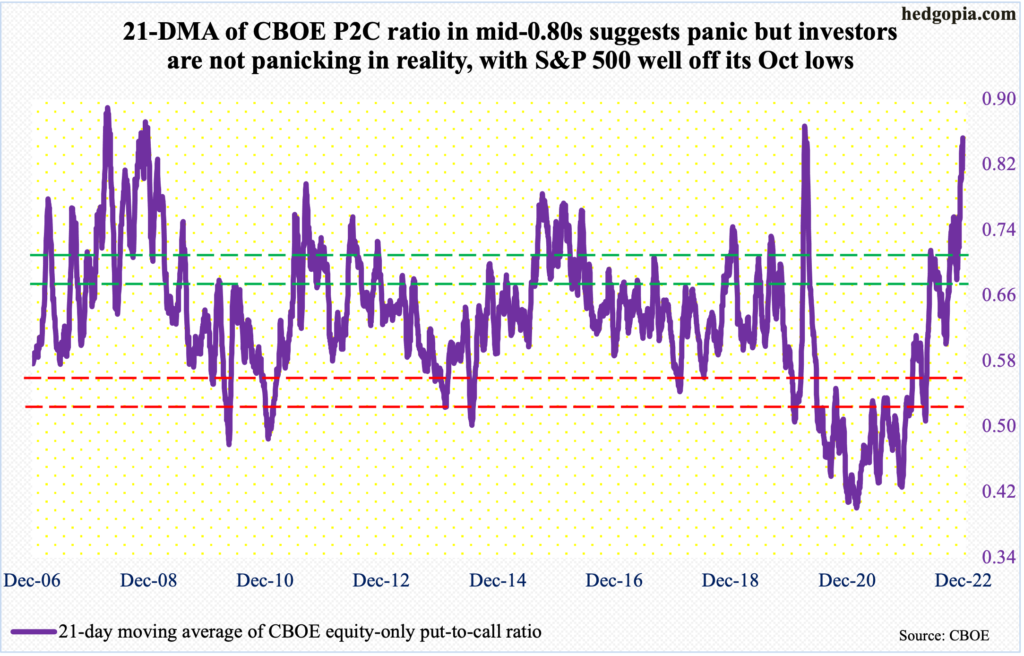
The S&P 500 rallied 5.4 percent in November. There were concurrently five one-or-higher CBOE equity-only put-to-call-ratio sessions, with three having registered in up days. This is not normal. The 21-day moving average of the ratio at mid-0.80s on Wednesday cannot be taken at face value.
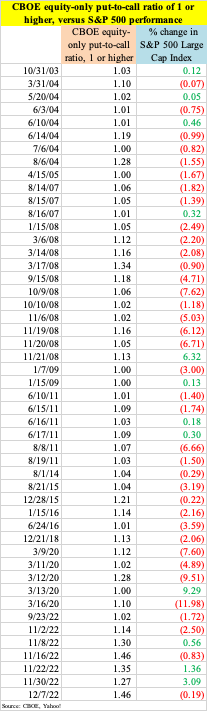
On Wednesday, the S&P 500 traded within a 35-point range, closing the session off 0.2 percent. The CBOE equity-only put-to-call ratio, however, produced a reading of 1.46, which is very high! Such high readings suggest puts are overwhelmingly much more in demand, and they tend to occur in sessions that are down – usually down big.
Of late, the put-to-call ratio has been acting weird – for lack of a better term.
In November, there were five sessions in which the ratio registered one or higher – on the 2nd, 8th, 16th, 22nd and 30th. In three of those – 8th, 22nd and 30th – the S&P 500 ended in the green, with rallies of 0.6 percent, 1.4 percent and 3.1 percent, in that order; the index dropped 2.5 percent on the 2nd and 0.8 percent on the 16th.
Simplistically, bears were simply not convinced the rallies were sustainable, hence piled into long puts (arguably, this could also comprise short puts betting the index was headed higher and that if it dropped, they were willing to buy).
One-plus readings are rare. In the table above, beginning October 21, 2003, there have only been 49 sessions in which the ratio was one or higher. That is out of 4,815 sessions! Out of the 49, the S&P 500 rallied in only 12, with a big majority up only nominally. The remaining 37 were all down – meaningfully at times.
As far as last month’s behavior is concerned, five one-plus sessions in a span of a month ordinarily suggest panic. But there is no investor panic currently, as the S&P 500 (3934) is well off the highs, having bottomed on October 13 at 3492.
It is hard to make a head or tail of November’s readings. Historically, they tend to signal a lasting bottom in equities. But at the same time, the one-or-higher readings also showed up when the markets rallied, particularly on November 30 when the S&P 500 shot up 3.1 percent and the ratio came in at 1.3.
The elevated readings of late have pushed up the 21-day moving average to a level that in the past has signaled a durable bottom in equities (chart above). On Wednesday, it stood at 0.852. This is very high and indicates panic, which, once again, is not really there in reality.
Alternatively, the October bottom in the S&P 500 is just a bottom, not the bottom. In this scenario, equities come under renewed pressure in the weeks/months to come, and there will be many more one-or-higher put-to-call-ratio days, driving the 21-day average still higher, and that will be a panic to buy.
Thanks for reading!
