At first glance, major U.S. equity indices are at/near all-time highs, with suppressed volatility. Amid this tranquility, the cost of protection is on the rise, and hedge funds’ net shorts in VIX futures are taking an increasing share of open interest.
U.S. equities had a good July, with the S&P 500 large cap index up 3.6 percent. August was lackluster, down 0.1 percent, with a monthly doji. Off the February low this year to the August high, the index rallied 21 percent. Fatigue is normal.
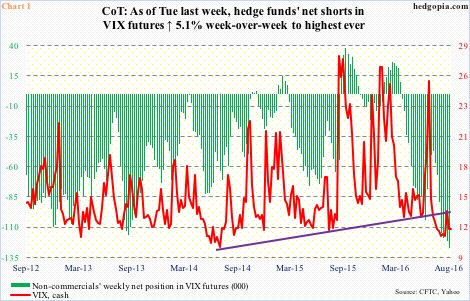
Performance-wise, September historically tends to be a challenging month. Nonetheless, hedge funds are essentially betting this year was going to be an exception. At 127,721 contracts as of Tuesday last week, non-commercials’ net shorts in VIX futures are the highest ever (Chart 1).
Volatility, both realized and implied, are at extremely suppressed levels. Spot VIX has traded below 15 for the past 44 sessions. In four of the five sessions last week, it tried to take out the 50-day moving average, but was denied. The Friday sell-off pushed the spot below both its 10- and 20-day moving averages.
To recall, early this year, these traders were up to their necks in net longs, peaking at 26,706 contracts on February 16th. The S&P 500 bottomed on the 11th that month. Gradually, net longs made way for net shorts, and spot VIX began to come under pressure from an intra-day high of 30.9 on February 11th.
For all intents and purposes, the massive presence of net shorts has massively tilted the volatility balance on one side. Unwinding these would come at a cost, which in this case would be upward pressure on spot VIX.
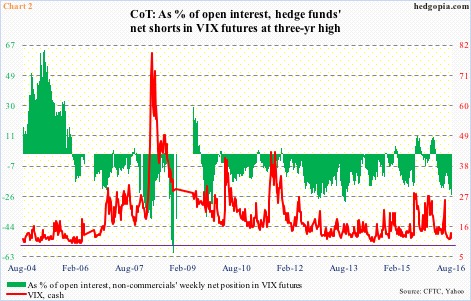
That said, as a percent of open interest in VIX futures, these net shorts, although highly elevated, would begin to look not as alarming as in Chart 1. As of August 30th, they made up 25 percent – the highest since 25.9 percent in the week ended September 10, 2013. In the past, in the panicky days of 2008, they rose as high as 60.6 percent on November 11, 2008. (There is a gap in the series between November 18, 2008 and June 2, 2009, and between May 23 and August 29 in 2006.)
Noticeably, along with non-commercials’ share, open interest itself has grown – from 248,064 as of February 23rd this year to 511,241 last week. This speaks of the conviction behind the trade, as spot VIX collapsed during the period. For the most part, it has been a right trade to pursue. But at what point does it become excessive and lopsided?
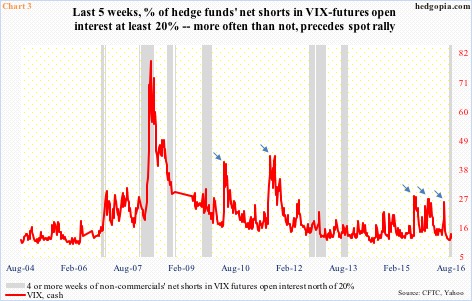
Once again, at first glance, the green bars in Chart 1 already look alarming, although less so if looked as a percent of open interest (Chart 2). Chart 3 tries to look at the issue from a different angle. The grey bars represent four or more consecutive weeks in which non-commercials’ net shorts in VIX futures constituted 20 percent or more of open interest. A trend emerges.
Granted the red line in Chart 3 has spiked plenty of times without the existence of grey bars (denoted by blue arrows), but does show a tendency to rise once accompanied by these bars. For the past five weeks, the share of non-commercials’ net shorts in open interest for VIX futures has remained north of 20 percent.
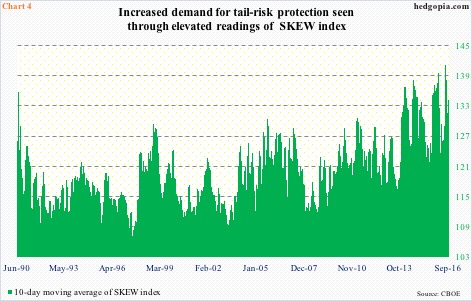
This is taking place amidst signs of increased demand for protection even as equity indices are hovering near all-time highs.
The SKEW index is derived from the price of S&P 500 tail risk. Value typically ranges from 100 to 150. A value of 100 means the probability of outlier returns is negligible. As it rises above 100, risk rises. Investors hedge exposure to tail risk by purchasing S&P 500 puts with low strikes, thus putting upward pressure on the prices of these puts.
SKEW is elevated currently. On Tuesday, it rose 2.76 to 131.16. Chart 4 plots a 10-day moving average of the index, and current readings are elevated.
This perceived risk in and of itself does not mean it will be realized. We are talking tail risk after all. That said, as things stand, even a normal pullback currently has the potential to feed on itself, given how placid volatility looks and how aggressively hedge funds are shorting volatility.
Thanks for reading!

