- U.S. household formation surges 1.8mn in four months to December
- Homebuilder sentiment drops to four-month low in Dec, but stays elevated
- ITB priced for reversal in years-long trend of renting versus owning – not a base case
There are good things happening in U.S. household formation. Finally!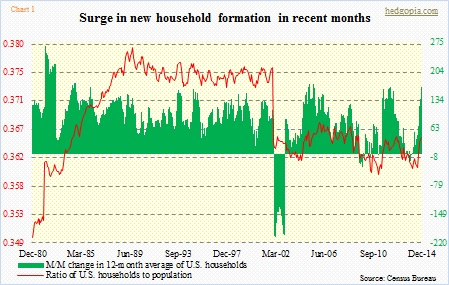
The number of households stood at 116.8mn in December, up 1.7 percent year-over-year. U.S. population during the period grew 0.7 percent. The ratio of households to population has spiked since August last year (Chart 1). The uptrend in household formation comes after it started shrinking beginning December 2013. From 115.1mn in November that year, it contracted to 114.6mn by March 2014. The past four months, however, there has been a spike in new formation. Recall that between September and December last year, the U.S. economy added 1.2mn non-farm jobs. Since August’s 115mn until December, the household count surged by 1.8mn. That is a lot of new households in four months.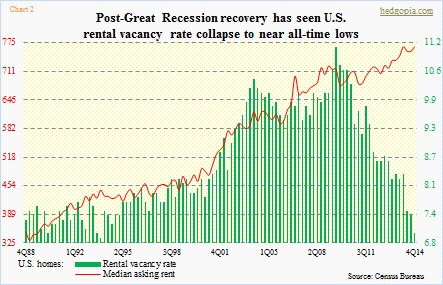
From the perspective of housing, news could not be better. The only question is if these new households would create demand for homes or they would continue to rent as has been the case in recent years. From around the time the post-Great Recession recovery began, the rental vacancy rate has dropped from 11.1 percent (3Q09) to seven percent in 4Q14 (Chart 2). The median asking rent, in the meantime, has continued higher – a record $766 in 4Q14. People are clearly opting for rental than ownership.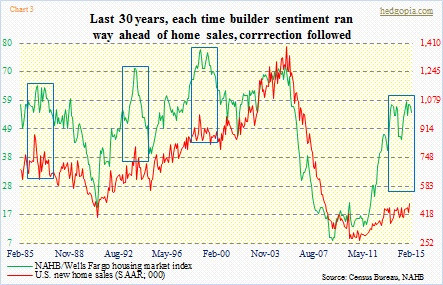
Homebuilders obviously would like a different outcome. Their optimism is reflected in builder sentiment, which has continued to stay elevated (Chart 3). This has been the case for a while now. The chart also shows the widening gap between sentiment and actual sales of new homes. In the past, every time builder sentiment ran way ahead of fundamentals, it has come crashing back down in due course. In December, the NAHB/Wells Fargo housing market index fell to a four-month low, but is still near levels of eight years ago.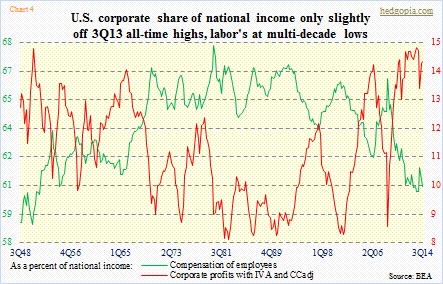
If there is any consolation, it is this.
From August to December last year, sales of new homes rose seven-plus percent. That was also the time when there was healthy growth in both non-farm payroll and household formation. As Chart 1 shows, if the ratio of households to population followed historical patterns, there is a lot of growth ahead in household formation. But that is about as far as comparisons go. It is the same economy, but with different tempo and momentum. The level of leverage is different. Monetary policy does not have much wiggle room left. And, last but not the least, labor’s share in national income is at multi-decade lows (Chart 4).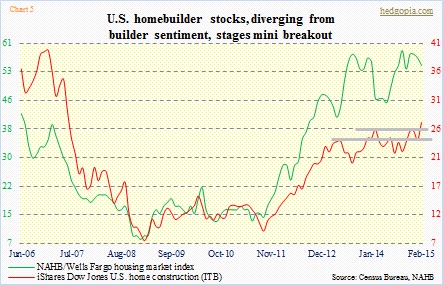
So it will be a shocker indeed if the red line in Chart 3 rises to meet with the green. As things stand now, it is safe to bet the other way – which is that the green line follows the red lower. If household formation continues to pick up momentum and home sales tag along, then we are looking at different dynamics. The latter scenario is what homebuilder stocks are betting on. They tend to follow builder sentiment closely. As a matter of fact, recently ITB has diverged from builder sentiment, with a mini breakout to boot (Chart 5). There is a lot of good news priced into these stocks. For that to come true, the recent trend of renting versus owning gets flipped on its head and reverses – not a base case.

