US households have built up massive equity in their homes, but homeowners are not rushing to tap into equity. Rising rates are probably to blame. The situation is unlikely to get better in quarters to come, as the Fed keeps benchmark rates elevated longer than currently priced in. The risk homeowners face is, the current downward momentum in price appreciation takes hold, adversely impacting owners’ equity.
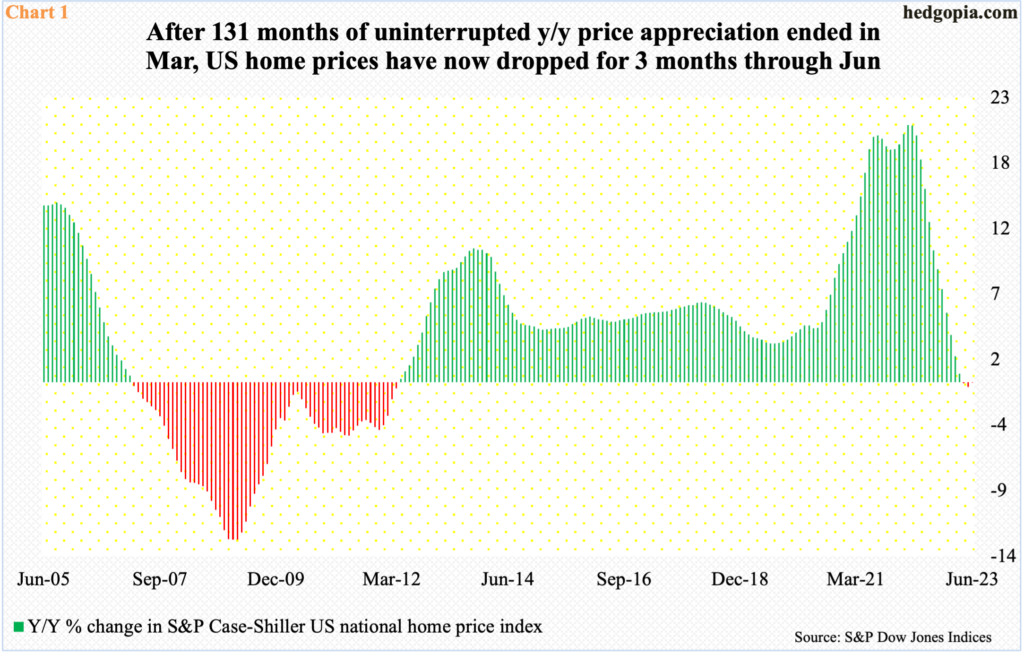
US home prices are dropping from a year ago, but only nominally so far.
In March last year, the S&P Case-Shiller US home price index increased 20.8 percent year-over-year. This was a record price appreciation nationally. Prices had been rising persistently since May 2012. After 131 months of uninterrupted increase, the streak ended in April this year, as the index edged lower 0.1 percent, followed by drops of 0.4 percent in May and 0.02 percent in June.
The three red bars on the right side of Chart 1 barely register. But prices began to lose momentum from a very elevated level, so it is probable the downward momentum continues. Plus, housing is in the middle of interesting dynamics.
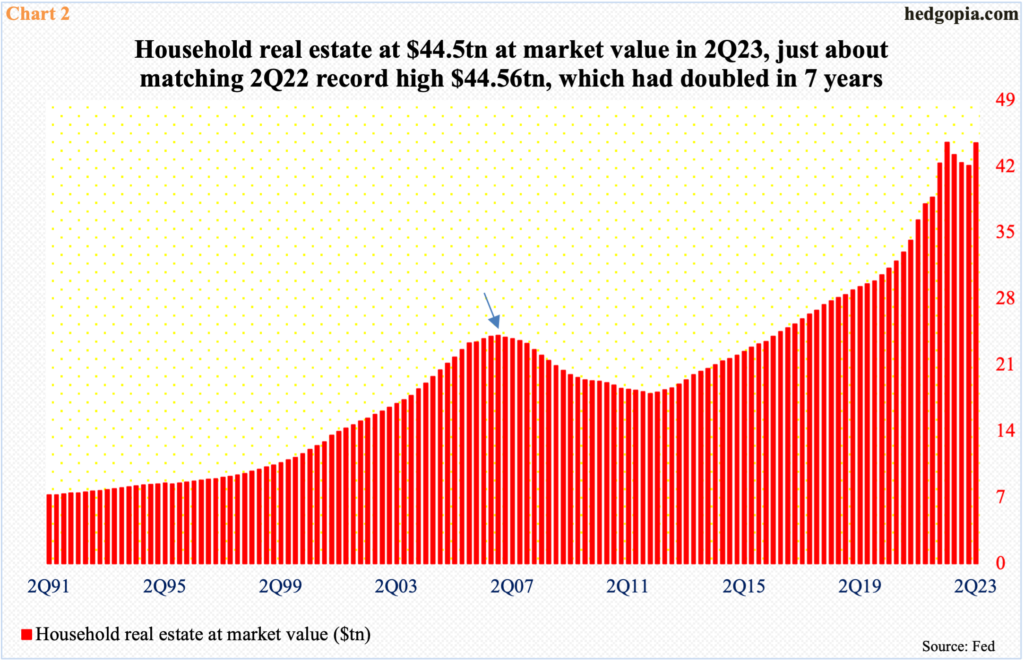
In 2Q23, household real estate was valued by the market at $44.5 trillion, which is just a hair’s breadth away from the all-time high $44.56 trillion reached in 2Q22. This is an astounding valuation accorded by the market. For reference, nominal and real GDP in 2Q23 were $26.8 trillion and $20.4 trillion, in that order.
During the housing bubble of nearly two decades ago, household real estate peaked at a valuation of $24.1 trillion in 4Q06 (arrow in Chart 2), before deflating and subsequently bottoming at $18 trillion in 1Q12. From that low through the 2Q22 new record, real-estate valuation surged 148 percent in a decade. As a matter of fact, the market value nearly doubled in seven years.
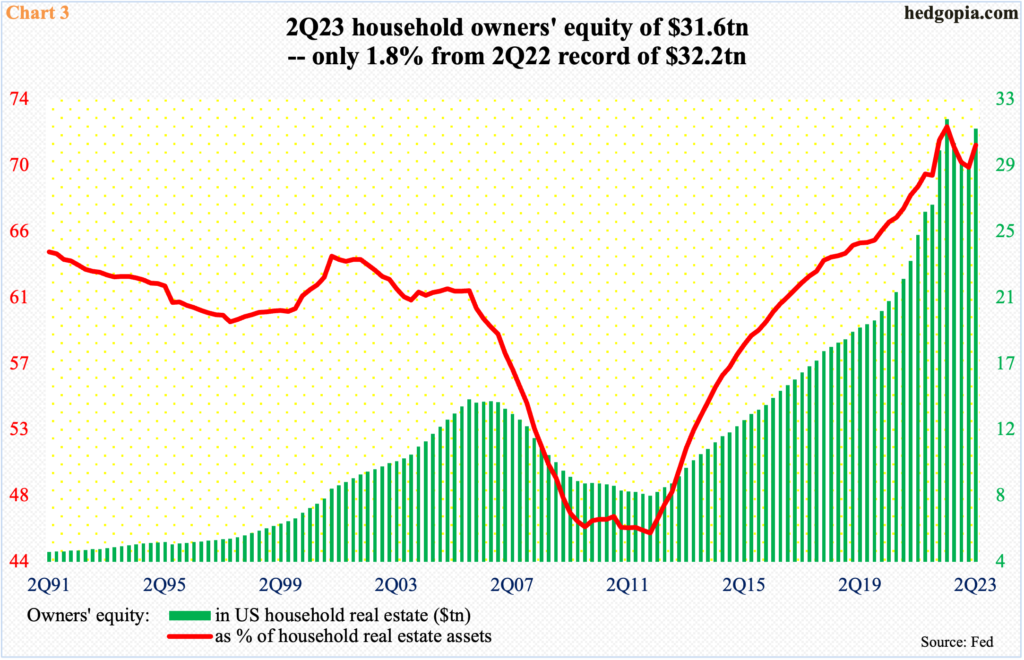
Not surprisingly, households are sitting on tons of home equity.
In 2Q23, owners’ equity in household real estate equaled $31.6 trillion, having peaked at $32.2 trillion in 2Q22, which had nearly quadrupled within a decade, as households held $8.5 trillion in equity in 2Q12.
Looking at this from another perspective, as a percent of household real estate, owners’ equity comprised 71.1 percent in 2Q23; the metric peaked at 72.3 percent in 2Q22 (Chart 3). Things are stretched, to say the least.
But homeowners are not able to meaningfully tap into this wealth.
Interest rates have shot up. After leaving the fed funds rate essentially zero-bound for two years, the Federal Reserve began to tighten in March last year. In the July meeting (this year), the benchmark rates were raised by 25 basis points to a range of 525 basis points to 550 basis points.
Other rates have followed suit.
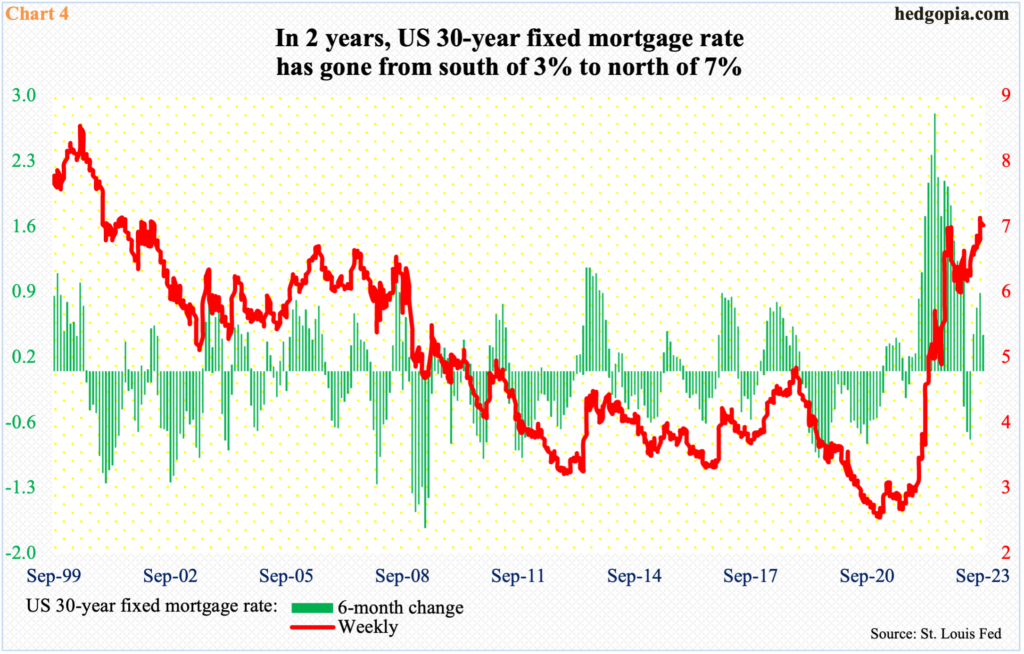
The 10-year treasury yield was around 1.7 percent in March last year; on August 22 this year, it tagged 4.36 percent before coming under slight pressure, ending last week at 4.26 percent. Accordingly, the 30-year fixed mortgage rate has shot up – from under three percent a couple of years ago to north of seven percent now.
The six-month change in the 30-year mortgage went negative in April and May, but this proved fleeting, as the upward momentum reasserted itself (Chart 4).
Consequently, the average rate on a home equity line of credit (HELOC) – a second mortgage giving the borrowers access to cash based on the value of home – is north of nine percent. HELOCs, which move with the prime rate, which in turn tracks the fed funds rate, use variable interest rates. For a borrower, these can be a better option than a cash-out refinance, which replaces current mortgage with a bigger mortgage with probably higher rates, and unsecured loans, which are currently averaging 11 percent.
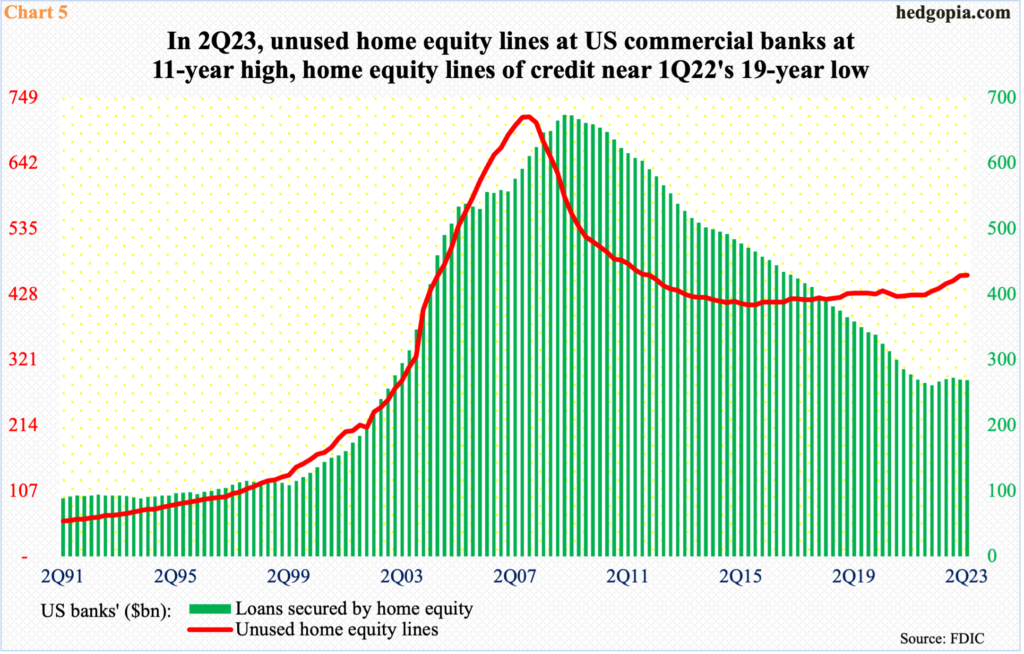
Nevertheless, home equity withdrawals are soft. In 2Q23, banks held $269.1 billion in home equity lines of credit – not too far away from a 19-year low of $261.3 billion posted in 1Q22 (Chart 5). Concurrently, the $459.2 billion in unused home equity lines last quarter was at an 11-year high.
It is increasingly looking unlikely these dynamics will change anytime soon. The 525-basis-point increase in the fed funds rate since March last year is taking time to have a desired effect. Jobs are holding up, although going by the weekly unemployment claims as well as non-farm job creation and openings, the pace is decelerating. Inflation is down from last year’s four-decade highs, but core inflation remains stubbornly elevated. In all probability, the Fed will leave the benchmark rates elevated longer than currently priced in. Homeowners who are patiently waiting for lower rates to tap into their equity will keep waiting. The risk they face is that the downward momentum that has begun in Chart 1 continues, which will then begin to adversely impact the green bars in Chart 3.
Thanks for reading!

