
Later this morning, August’s housing starts will be released. In recent months, momentum has picked up. July was 1.21 million units (at a seasonally adjusted annual rate) – the highest since 1.26 million in October 2007.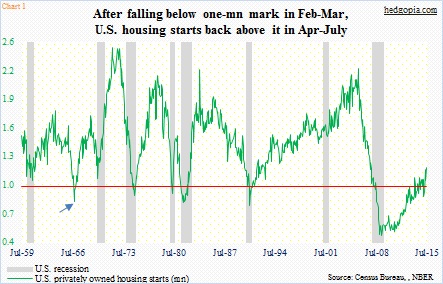
In non-recessionary periods, it is rare for starts to drop below one million. It happened in 1966 (arrow in Chart 1). Other than that, it tends to stay above that mark except when the economy is in contraction. The current cycle has been an exception. After the housing bubble burst, and during the subsequent recession, starts dropped all the way to 478,000 in April 2009, just before Great Recession ended. Since then, progress has been steady, and gradual. It was not until November 2013 that starts went back above one million, and stayed there since, give and take. In June and July, the pace quickened – to a 1.2-million range. The 12-month rolling average has stayed north of a million units since last December.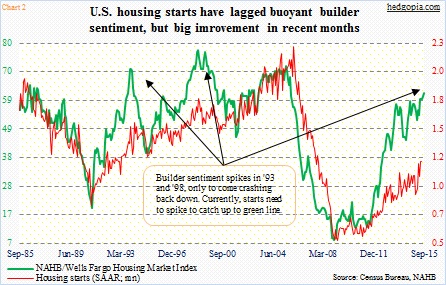
Starts tend to closely track builder sentiment. There have been times in the past when the latter runs way ahead of the latter, only to soften later (arrows in Chart 2). Even now, the green and red lines are far too apart. With that said, directionally they have been moving in tandem. The National Association of Home Builders housing market index rose a point in September to 62 (came out yesterday). This is the highest reading since 68 in October 2005. Moving hand in hand, the recent trend in starts has been nothing but encouraging.
Builders have been finally putting their money where their mouth is. Improving trends in sales have helped. In five of the first seven months this year, new home sales have come in north of a seasonally adjusted annual rate of 500,000 (Chart 3). In July, sales of existing homes were 5.59 million (SAAR) in that month – the highest since 5.79 million in February 2007 (not shown here).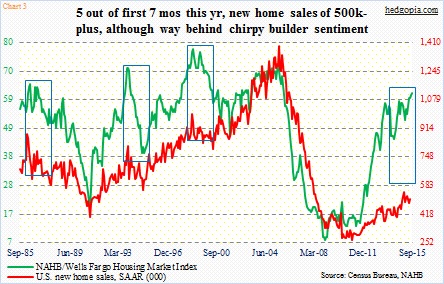
Before we declare it is all good in housing from here on out, a couple of things are worth considering.
Unlike in Chart 2 in which the red and green lines have been moving in sync – in recent months in particular – it is different in Chart 3. The gap between the two lines is widening. The red line refuses to follow the green line higher. Several times in the past, such divergence is followed by the green line coming under pressure to go meet with the red.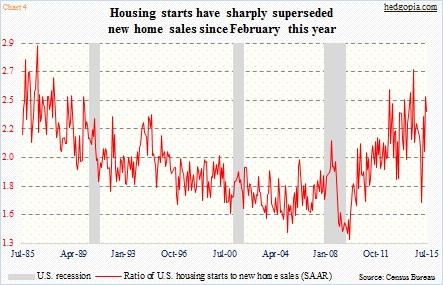
In fact, the ratio of housing starts to new home sales does indeed find itself at an elevated level (Chart 4). The reading was 2.38 in July, down from 2.5 in June, but up substantially from 1.65 last February. In recent months, starts have picked up a notch or two. To resolve this, either sales need to cooperate – by rising faster than starts – or starts need to soften. Hence the importance of this morning’s release. In a scenario in which the ratio continues to widen, the ‘supply of new homes’ metric takes on added importance. In July, this number stood at 218,000 (SAAR) – the highest since 227,000 in March 2010. It is worth a watch.
Thanks for reading!
