
Job growth and household formation are healthy. However, housing starts are falling behind. Not to mention the yawning gap between renter-occupied versus owner-occupied housing units.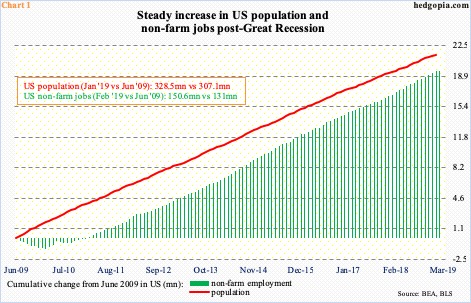
The post-financial crisis recovery is just three months short of completing a decade. Great Recession ended in June 2009. Overall, the recovery is sub-par, with real GDP averaging growth of 2.3 percent versus 3.2 percent going all the way back to 2Q47. Job growth has been decent. Through February, 19.6 million non-farm jobs have been created, to 150.6 million. Through January, population increased by 21.4 million, to 328.5 million (Chart 1). This obviously creates demand for housing.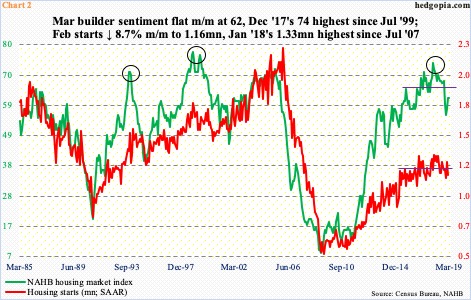
In June 2009, US housing starts were 585,000 units (at a seasonally adjusted annual rate). After the bubble burst, starts were in the process of bottoming then. In April of that year, they dropped to as low as 478,000 units, from a peak of 2.27 million in January 2006. In February (this year), starts fell 8.7 percent month-over-month to 1.16 million. Since reaching a cycle high 1.33 million in January last year, starts have been trending lower.
Therein lies the rub.
Starts have essentially gone sideways for over three years now. Right around the time starts peaked last year, builder sentiment reached a multi-year high. The NAHB housing market index reached 74 in December 2017, which was the highest since 75 in July 1999 (Chart 2). Sentiment this month was flat at 62.
The prevailing apathy among builders to break new ground is taking place even as job growth and household formation continue at a healthy clip.
Last December, households rose 82,000 m/m to 122.6 million. They have come a long way. In June 2009, there were 112.3 million households. Chart 3 uses a 12-month rolling average, and as can be seen, households began to grow at a faster pace a little over four years ago. Post-Great Recession, households increased by 10.3 million units.
That said, this healthy-looking growth has not quite kept up with growth in jobs. The ratio of households to non-farm jobs peaked nearly nine years ago, and has essentially gone sideways for two years now.
This has probably to do with other underlying duress. Jobs are there, but if these are primarily low-paying jobs, people would not feel confident to form a household. Many young adults still live with their parents. Those that are ready to form a household may decide to do so by renting than owning. On the latter point, Chart 4 is a good case in point. It shows by how much owner-occupied housing units grew post-Great Recession versus renter-occupied. The latter wins hands-down.
As of 4Q18, there were 138.9 million housing units in the country. Of this, 16.4 million were vacant and 122.5 million occupied. Of the latter, 79.4 million are occupied by owners and 43.1 million by renters; since the last recession ended, these have respectively grown by 3.8 million and 6.6 million, which is what the chart shows. In general, a renter would rather own if s/he was financially capable. The green line in the chart has been rising, but not enough to match the red bars. This is occurring in an expansion. We can only imagine how the owner-renter dynamics might fare when the next downturn hits.
Thanks for reading!
