As the third quarter ended, S&P 500 companies were yielding a touch higher than the 10-year Treasury yield – something equity bulls have been stressing to highlight how cheap stocks are. Is it that simple?
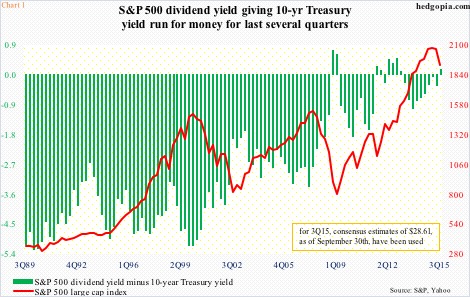
Last quarter, the four-quarter rolling total of S&P 500 dividends were $42.51 – the highest ever – yielding 2.2 percent. The 10-year yield closed the quarter at 2.1 percent. This was the first positive spread between the two since 1Q13 (Chart 1).
To be clear, the green bars in Chart 1 have been persistently moving up for at least 25 years. This was more a function of interest rate coming down than dividend yield moving up. Going back to 1Q89, the 10-year yielded 9.4 percent, versus dividend yield of 3.4 percent. Interest rates had already been coming down since the early ‘80s, and they kept going lower. Dividend yield, on the other hand, has vacillated within a range – between one-plus percent and three-plus percent – dropping to as low as 1.1 percent in 1Q00. Most recently, it dropped to 1.9 percent in 4Q14, and has risen since. The 3Q drop in stocks helped.
In the current cycle, S&P 500 dividends have persistently been in an uptrend, having dropped to $5.35/share in 3Q09; six years later, they were $10.79. Dividend yield more or less has stayed the same, thanks to a massive rally in stocks.
So begs the question, how sustainable are these dividends?
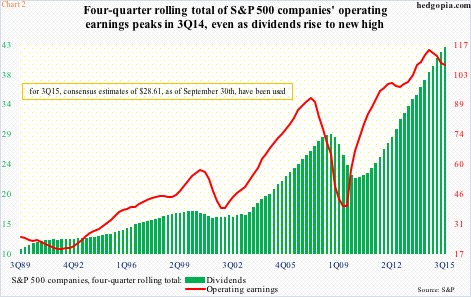
Chart 2 plots S&P 500 operating earnings with cash dividends on a four-quarter rolling total basis. The green bars (dividends) continue to rise, even as the red line seems to be rolling over. Operating earnings peaked at $114.51 in 3Q14, and were $107.32 four quarters later. For the third quarter, consensus estimates of $28.61 (as of September 30) have been used.
Earnings trend is clearly down. On an operating level, 2015 estimates have been persistently coming down for 2015 – from as high as $137.52 at the end of the second quarter last year to the latest $110.98. Ironically, 2016, as high as $137.46 in February this year, has been cut down to $129.37. Even after the cut in estimates, earnings next year are expected to jump 16-plus percent. This at a time when increasingly it looks like the powerful forces of debt deleveraging are winning over central-bank activism. Odds favor 2016 estimates will continue to be revised downward.
In this scenario, for dividend yield to even remain static, either stocks will have to go down or companies dole out more of their earnings in dividends.
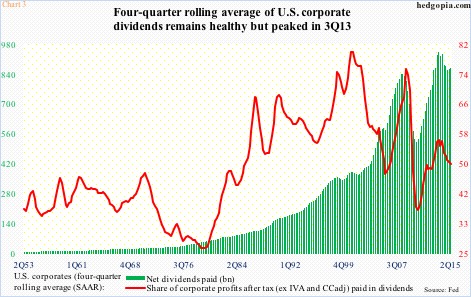
On a broader level, the four-quarter rolling average of net dividends paid by U.S. corporates peaked at $943.9 billion in 3Q13, declining to $870.9 billion by 2Q15. Corporate profits after tax (before adjusting for inventory valuation and capital consumption) between the periods were $1.68 trillion and $1.75 trillion, respectively. In other words, the payment ratio dropped from 56.2 percent to 49.6 percent (Chart 3).
Why is this important?
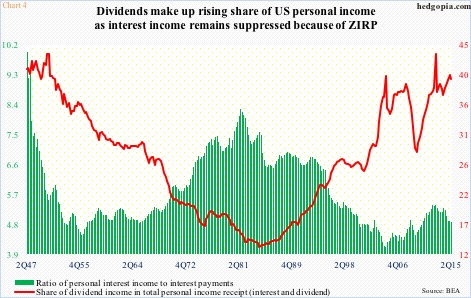
Take a look at Chart 4. In the current cycle, dividends have played an increasing role in personal income. In 2Q15, dividend and interest income added up to $2.18 trillion, matching the total in 3Q08. Between the periods, interest income was $1.3 trillion and $1.4 trillion, respectively. Dividend income was $865 billion and $797 billion, in that order. Thanks to zero interest-rate policy, interest income remains suppressed – more so than interest payment does. The green bars represent a ratio between the two, and has been under pressure particularly the past three years. Hence the significance of dividend income in the mix.
Any scenario in which this source of income is at risk of declining obviously can amount to weaker consumer spending. Given how elevated next year’s estimates are and how that might impact the payout ratio, this is not a scenario that can be easily dismissed.
The spread between S&P 500 dividend yield and the 10-year yield does not tell us a whole lot as to where things might be headed.
Thanks for reading!

