
In 1Q18, S&P 500 companies reported $36.54 in operating earnings, up 26.8 percent year-over-year and eight percent quarter-over-quarter. This was non-GAAP. GAAP was up 20.3 percent y/y and 22.5 percent q/q to $33.02.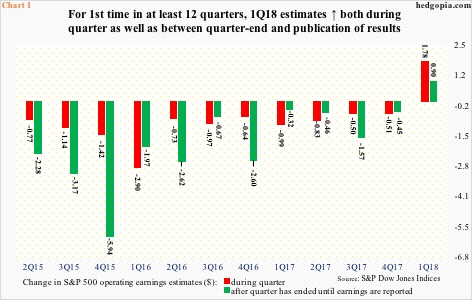
Apart from being a record quarter, 1Q18 also delivered a shift in a trend that prevailed in at least the prior 11 quarters. The two bars in Chart 1 represent (1) the change in non-GAAP consensus estimates during a given quarter and (2) by how much actual earnings exceed or come up short after a quarter has closed. In the prior 11 quarters going back to 2Q15 both these bars were consistently in the negative. For instance, between 3Q and 4Q last year, 4Q17 estimates were lowered by $0.51. Then between December and when companies were done reporting the quarter, estimates went down by another $0.45. This pattern changed in 1Q18.
When 1Q18 began, estimates for the quarter were $33.86. By the time the quarter came to a close, the sell-side had penciled in $35.64, up $1.78. Companies are just about done reporting. As mentioned earlier, they earned $36.54, $0.90 higher than when the quarter ended. If sustained, this is a big improvement in trend.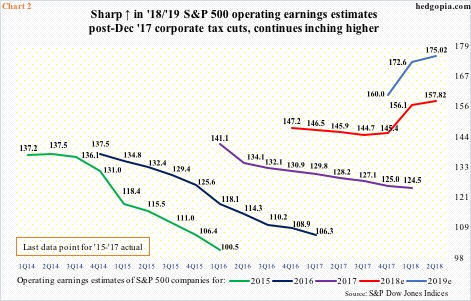
Sustainability is the key issue here. One possible reason why the trend shifted in 1Q18 is last December’s tax cuts. The Tax Cuts and Jobs Act of 2017 was passed into law on December 22, subsequent to which the sell-side aggressively raised estimates for both this year and next. On December 21, they were expecting S&P 500 companies to earn $145.31 this year. By May 3, this had jumped to $157.65, before getting revised down a bit. As of last Friday, 2018 consensus stood at $157.82, a new high. Next year’s is at $175.02, also a new high (Chart 2). Tax cuts were a new variable in their model, and they are still revising numbers. This may have played a role in the trend shift in Chart 1.
The question is, is the trend here to stay?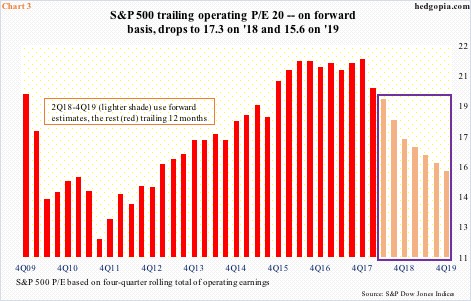
In general, bottom-up estimates tend to go down leading up to and as companies report earnings, which is what is reflected in Chart 1, except for 1Q18. This phenomenon lowers the earnings hurdle for these companies.
If instead what we saw in 1Q18 is a one- or two-quarter phenomenon, then it will have consequences for Chart 3, which plots the operating price-to-earnings ratio for S&P 500 companies. In the chart, a four-quarter rolling total of earnings is used, with trailing 12-month earnings up to 1Q18 and forward after that. On that basis, 4Q17 traded as high as 21.5x – elevated historically. Using forward, however, it begins to look a lot less egregious. The post-tax-cut jump in ’18-’19 estimates enables this. On ’19 estimates, the P/E shrinks to 15.6x. If the downward revision trend reasserts itself – how ’15-’17 evolved is a good example (Chart 2) –then it is just a matter of time multiples begin to come under upward pressure. This of course assumes the S&P 500 does not drop meaningfully.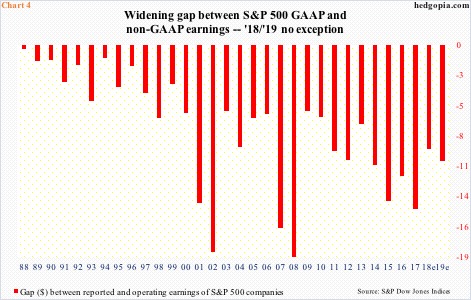
It is worth pointing out that despite the sharp jump in ’18-’19 estimates post-tax cuts, there has been no change in a trend that has plagued US corporate earnings for a while, which is the gap between GAAP and non-GAAP. Both are important in their own right. It is very possible non-GAAP tends to overstate earnings, while GAAP does the opposite. On balance, the lesser the discrepancy between the two the higher the quality of earnings, which was the case three decades ago. Then the gap began to widen. And widen it did. During recessions, GAAP earnings collapse as companies take asset write-downs, etc. The two tallest bars in Chart 4 belong to 2002 and 2008. However, the post-Great Recession earnings recovery has anything but narrowed the gap between GAAP and non-GAAP. As things stand, next year it is expected to be minus $10.39, up from minus $9.30 this year.
Thanks for reading!
