
The two major U.S. presidential candidates share at least one common interest. Both talk about the need to increase infrastructure spending.
Democrat Hillary Clinton has a five-year $275-billion program. Republican Donald Trump says he would spend at least twice as much as what Mrs. Clinton plans to invest, and that it would be financed with debt.
In recent years, there have been attempts to pass an infrastructure bill, but disagreements over how to fund them have hindered progress. President Barack Obama’s $478-billion infrastructure program did not get through Congress. In that matter, history is not on Mrs. Clinton’s or Mr. Trump’s side.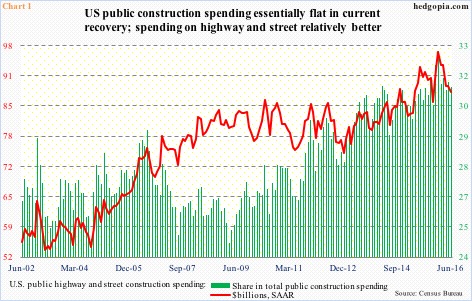
Be that as it may, the fact remains that the nation’s roads, ports, bridges, airports, energy grid, sewer and water systems, among others, are in sore need of an upgrade, with the average age under persistent upward pressure.
Chart 1 plots public highway and street construction spending and its share in total public construction spending.
Spending on highway and street dropped 1.4 percent m/m in June to a seasonally adjusted annual rate of $88 billion. The all-time high was reached in January this year at $96.5 billion. As a share of total public spending, highway and street’s pie has grown, but the total pie has not.
In June, public construction spending fell 0.6 percent month-over-month to a seasonally adjusted annual rate of $282.5 billion. Most recently, spending peaked at $300.6 billion in June last year. The all-time high was recorded in March 2009 at $325.5 billion, meaning spending has been flat as a pancake in the current recovery.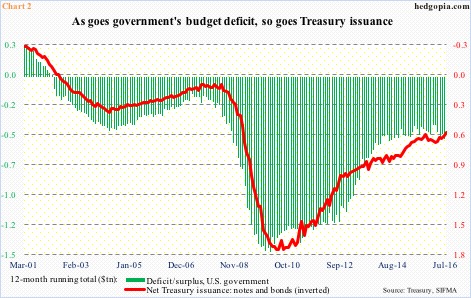
This was at a time when the nation was running a heavy budget deficit. Just coming out of Great Recession, deficit, on a 12-month running total basis, ran as high as $1.5 trillion in February 2010. Till February 2013, the deficit was still north of $1 trillion, before gradually dropping to $405.3 billion in January this year. June came in at $523.6 billion (Chart 2). Issuance of Treasury notes and bonds has followed right along.
Depending on also what happens in Congressional elections, if Congress goes along with either of the two candidates’ program, the red bars in Chart 2 are all set to move higher.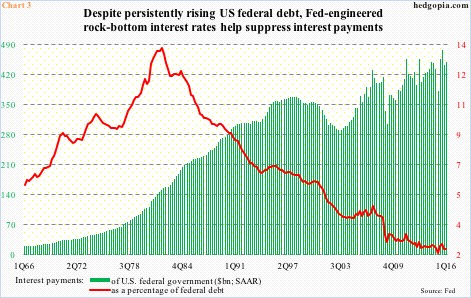
A cogent argument can be made that this is as good a time as any to issue debt for infrastructure spending. Interest rates continue to hover around historically low levels. What better time to issue debt in order to add to the nation’s capital stock?
In fact, the U.S. already massively benefits from the Fed’s zero interest rate policy. Interest payments as a percentage of federal debt dropped to a low of 2.11 percent in 1Q15, rising slightly to 2.33 percent in 1Q16. Interest payments at a seasonally adjusted annual rate were $448.7 billion in 1Q16. In 2Q07, they were $430 billion – essentially flat. The difference between then and now is that federal debt back then was $8.9 trillion, versus $19.3 trillion now. Despite more than doubling the debt load, interest payments have only marked time. All thanks to the Fed.
This is precisely the point made by ardent fans of infrastructure spending: the low debt servicing cost that exists today is too alluring to pass.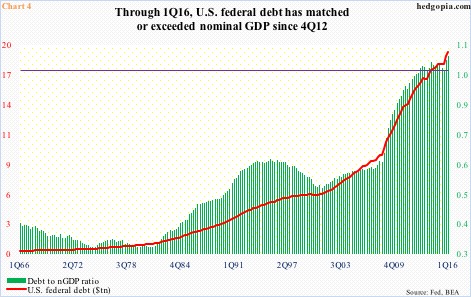
The problem with this is that the debt load is already too big. Since Great Recession ended in 2Q09, federal debt has gone up by nearly $8 trillion. In 4Q12, for the first time ever federal debt exceeded nominal GDP, for a ratio of north of one, and has remained that way since. In 1Q16, the ratio was 1.05 (Chart 4).
If nothing else, this in and of itself can inhibit either President Clinton or President Trump from carrying out their infrastructure plans unless their party also takes control of Congress.
Thanks for reading!
