Investors Intelligence bulls-to-bears ratio hit four this week – a rare occurrence. This is taking place at a time when internals on the Nasdaq are diverging with the index. Tech’s importance is all too known, with the top five US companies accounting for nearly 42 percent of QQQ and nearly 23 percent of SPY.

Sentiment is holding up at an elevated level.
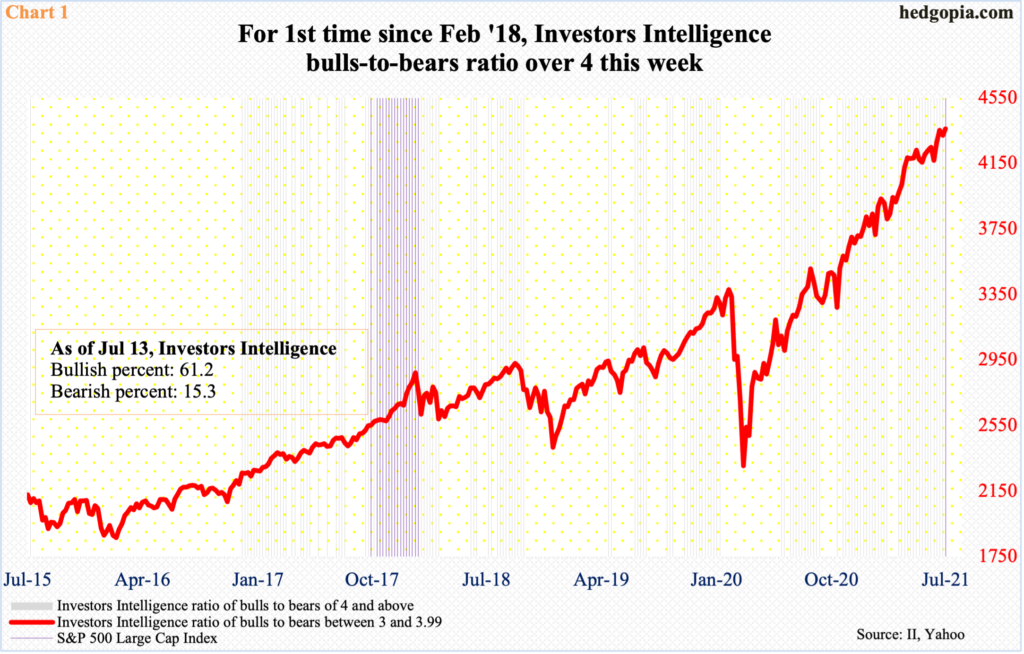
This week, Investors Intelligence bulls rose four-tenths of a percentage point week-over-week to 61.2 percent – a 12-week high. This was the second consecutive week of north of 60 percent. Bears slid two-tenths of a percentage point w/w to 15.3 percent. As a result, the bulls-bears ratio hit four – the first such occurrence since February 2018 (Chart 1).
Sentiment has remained in 0.50s and 0.60s since May last year, with the ratio north of three without interruption for nearly four months now.
Readings north of four are rare. But there are also times when they persisted at elevated levels for weeks. Between October 2017 and Januuary 2018, the ratio was four or higher for 15 weeks in a row – and in 16 out of 17 – with three of them north of five. This is what equity bulls are wishing for.

Major US equity indices rallied big into earnings. The 2Q season is in its second week. Last week, the S&P 500 Large Cap Index ended up with a weekly hanging man. This was also the case with the Nasdaq Composite. Sitting on massive gains, sellers are beginning to come out near the highs. With one session to go this week, the Nasdaq is down 1.1 percent.
Tech is important in this respect, if nothing else just considering the influence it has on market cap-weighted indices. The top five US companies – Apple (AAPL), Microsoft (MSFT), Amazon (AMZN), Google owner Alphabet (GOOG) and Facebook (FB) – are all tech and account for nearly 42 percent of QQQ (Invesco QQQ Trust) and nearly 23 percent of SPY (SPDR S&P 500 ETF).
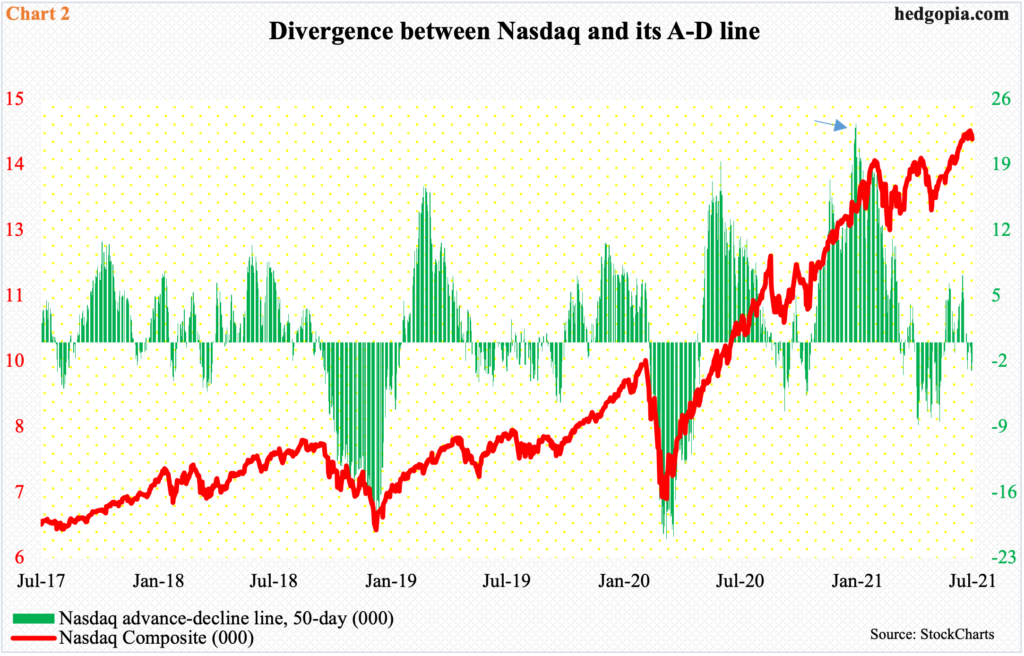
With momentum on their side, bulls continue to buy the dips. But this will not work forever, especially not when some of the internals have diverged with the Nasdaq. Chart 2 pits the Nasdaq with its advance-decline line. The latter peaked as early as January (arrow), even as the index continues to trudge higher.
Just because the A-D line has diverged, there is no guarantee that the index will follow it lower. If they have diverged this long, they can do so a while longer. Hence the significance of Chart 1 and how the remainder of the earnings season shakes out. Tech is beginning to report, with all of the top five reporting in the week after, and this in all probability will act as a sentiment catalyst. If post-earnings reaction to financials is any guide, it will be to the downside.
Thanks for reading!

