
Investors Intelligence bulls this week posted the highest since early October 2018 when US stocks were peaking. This time around, stocks rallied big the last 15 weeks. Bullish sentiment is way elevated. The Russell 2000, which currently sits at crucial support, is worth a watch.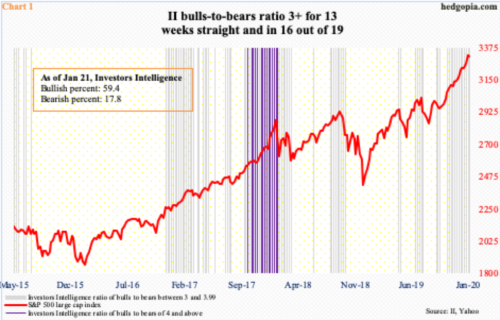
Investors Intelligence bulls this week rose 2.4 percentage points week-over-week to 59.4 percent. Bears remain unchanged at 17.8 percent for four weeks. This week’s bullish percent is the highest reading since hitting 61.8 percent in the first week of October 2018. Back then, the elevated reading coincided with the beginning of a three-month nasty correction in US stocks. Leading up to and a week after that peak, the ratio of bulls to bears remained north of three for nine consecutive weeks.
This time around, the ratio has posted three-plus readings for 13 weeks in a row – and in 16 out of 19 (Chart 1). Stocks have rallied big since early October last year. From those lows through recent highs, the S&P 500 large cap index rallied 16.6 percent, the Dow Industrials 14.1 percent, the Nasdaq Composite 22 percent and the Russell 2000 small cap index 17.3 percent.
Once unwinding of this bullish sentiment begins in earnest, there is a long way to go on the downside for sure. During the October-December downdraft in 2018, stocks bottomed late December, even as by the first week of January 2019 bulls had dropped to 29.9 percent and bears rose as high as 34.6 percent. Sentiment had gone from one extreme to the other, which laid the foundation for the rally that followed.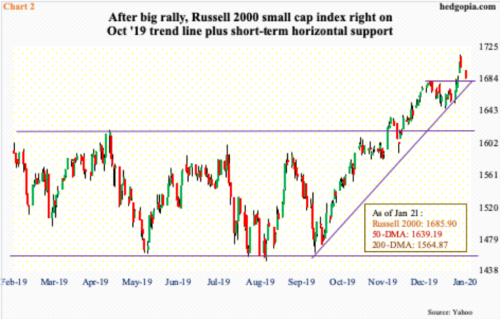
In the present context, the pendulum has heavily swung the bullish way. Nothing says it cannot continue. As a matter of fact, the last time the bulls-to-bears ratio read four or higher was two years ago. It can happen – at least that is what bulls are hoping for. That said, when things are this hot and heavy, they can reverse quickly as well, and it pays to be on one’s toes.
Traditionally, one of the groups investors tend to gravitate toward when they are in a mood to take on risk are small caps. They currently sit at crucial juncture. From early October last year to last Friday’s intraday high, the Russell 2000 small cap index (1685.90) rallied big. In so doing, it took out major resistance just north of 1600 (Chart 2). As the rally was unfolding, bulls were able to defend support at 1450s. As a result, using a measured-move-price approach, range-breakout traders would be looking to at least test the all-time high of 1742.09 from August 2018. Last Friday, sellers quickly showed up as the index tagged 1715.08 intraday. Tuesday, it dropped 1.1 percent to essentially land on dual support – short-term horizontal plus trend line from early October. The latter in particular is important. A breach can potentially open the door to 1600+ breakout retest. If things evolve this way, the prevailing bullish sentiment can take a hit, although it likely will not sustain a major hit until 1600+ is lost.
Thanks for reading!
