
Despite the massive rally in stocks since December lows, Investors Intelligence bulls are not giddy, though NAIIM members are not quite sending the same message. Ditto with the percent of S&P 500 stocks above the 50-day.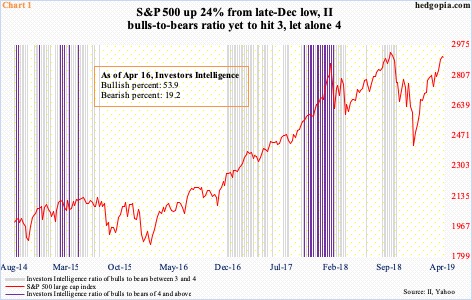
Investors Intelligence bulls continued to inch up this week. At 54.8 percent, bulls’ count rose nine-tenths of a percentage point, to a 27-week high. Bears were unchanged at 19.2 percent. Bulls have remained in the 50-percent range for nine weeks now. Early October last year, the very week stocks began a cliff-dive, bulls peaked at 61.8 percent, before bottoming at 29.9 percent early January. Stocks bottomed late December. The S&P 500 large cap index is up 24 percent from that low.
Despite the massive rally in stocks, investor sentiment has not quite gotten giddy. The last time the ratio of bulls to bears crossed three was early October last year. It has not hit four or higher since late January last year (Chart 1). Currently, this metric can be spun by both bulls and bears alike to suit their own bias. Bears use this to argue that the current rally is simply unsustainable. For bulls, this means there is room for the bullish percent to continue higher before stocks peak.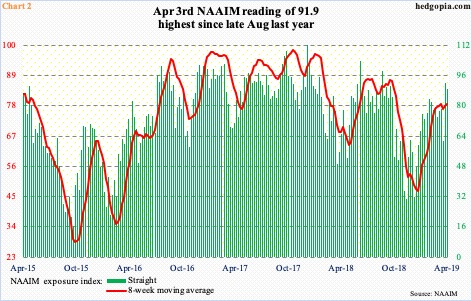
Elsewhere, the NAIIM (National Association of Active Investment Managers) exposure index last week fell three points week-over-week to 88.9. (This week’s reading will be out today.) The index shows members’ average exposure to US equity markets. Unlike Investors Intelligence, which is survey-based, we are talking real money here. Last week’s count was the highest since late August last year when it peaked at 98.3 percent (Chart 2). Mid-December last year, it bottomed at 32 percent, and obviously has come a long way. Looking at their exposure, NAAIM members have not sat out this rally. The NAIIM message is slightly different from the one coming out of Investors Intelligence.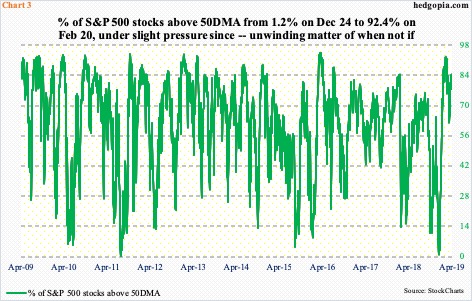
Amidst this, the S&P 500 is merely 1.2 percent from its all-time high of 2940.91 from last September, but the percent of stocks above the 50-day moving average is beginning to act weaker than the index itself.
On February 20, the green line in Chart 3 peaked at 92.4 percent. This is crazy high, thus hard to sustain. It has since come under pressure, even as the index trudges higher. Tuesday, 77.6 percent of S&P 500 stocks were above the average. On Christmas Eve, 1.2 percent were – a washout, which laid the foundation for the rally that has gone on for nearly four months now. Now, the metric has gone the other way – from one extreme to the other. Continued unwinding of the current overbought condition may mean Investors Intelligence bulls are right not to go overboard.
Thanks for reading!
