
U.S. household real estate has come a long way.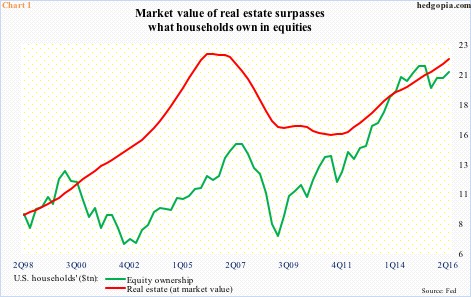
Back in 2Q06, the market value of U.S. household real estate peaked at $22.7 trillion, before coming under sustained pressure after the bubble burst. Amazingly, in the next five years, it lost nearly $7 trillion, bottoming at $15.9 trillion in 2Q11. The recovery since has been nothing short of impressive.
In 2Q16, the market value of household real estate increased 6.6 percent year-over-year to $22.2 trillion, a hair’s breadth away from the 2Q06 peak. Even more impressive, real estate has now surpassed households’ equity holdings – $21.2 trillion in 2Q16. In fact, after six quarters in which the red line in Chart 1 remained under the green line, it went back above in 3Q15.
Accordingly, for Americans, the concept of wealth effect applies as much to real estate as it does to equities. As a matter of fact, between the two, real estate probably has an edge as it is much more widely held.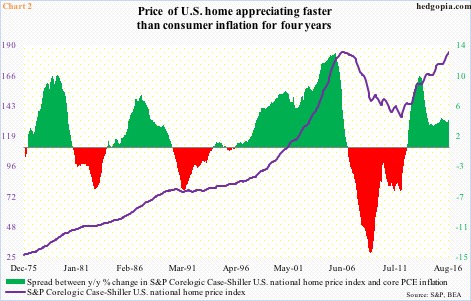
This wealth has been created thanks to the rapid price appreciation over the last several years. The S&P Corelogic Case-Shiller U.S. national home price index (quite a mouthful) peaked in July 2006 at 184.62, later bottoming at 134.01 in February 2012. Then followed a steep rise (Chart 2). In August this year, the index rose 5.3 percent month-over-month to 184.42, just about matching the all-time high of a decade ago.
For a little more than a year in 2013/14, home prices rose at a double-digit rate. The rate of increase has decelerated, but has been in the five-percent range for two years now. This at a time when consumer inflation has struggled to consistently rise at two percent annually. The spread between home price increase and inflation has been positive for four years now (Chart 2).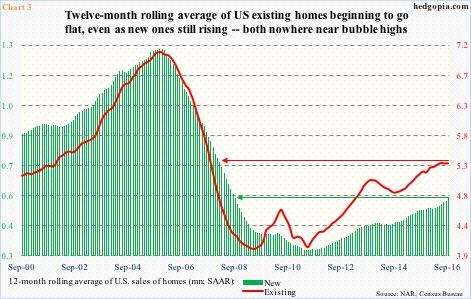
The median price of an existing and new home reached new highs in June this year – respectively at $247,600 and $321,600. As of September, prices are down 5.7 percent and 2.6 percent respectively from those highs (chart here). Prices have managed to rise to fresh records, but not sales.
In September, sales of existing and new homes rose 3.2 percent and 3.1 percent m/m to a seasonally adjusted annual rate of 593,000 and 5.47 million. They were both down from recent cycle highs – 629,000 in July this year and 5.57 million in June, in that order.
On a 12-month rolling average basis, sales of existing homes have come under slight pressure since 5.35 million in June this year, even as new homes are still rising. But both are way off the bubble highs (Chart 3).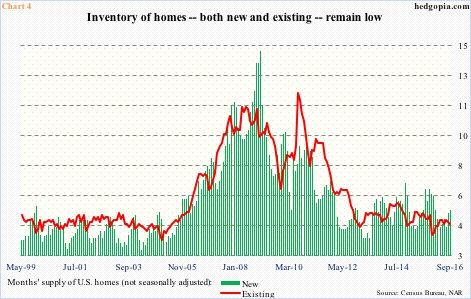
From the price perspective, supply constraints have helped. Ditto with mortgage rates; that said, interest rates have stayed low for so long there probably is no longer an incentive to lock in “low” rates. Plus, income growth remains subdued. But inventory remains a tailwind.
In September, months’ supply (not seasonally adjusted) stood at 4.5 for existing and 5.3 for new homes. Both have come off recent lows, but remain low historically (Chart 4).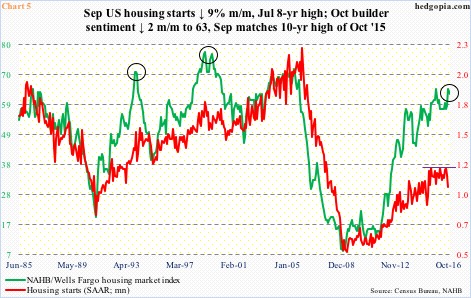
Rather curiously, builders say one thing and do the other. They sound very optimistic in surveys but hesitate to put up the capital to break ground for new projects. Housing starts are subdued, considering the months’ supply.
Starts dropped nine percent m/m in September to a seasonally adjusted annual rate of 1.05 million units (Chart 5). Earlier in July, they rose to 1.22 million units – on par with 1.21 million units in February this year and June last year. As is the case with sales, starts are nowhere near bubble highs.
Builder sentiment, on the other hand, remains elevated. The NAHB housing market index came in at 65 in September, tying with the 10-year high of October last year. If past is guide, the wide gap between the green and red lines in Chart 5 will be resolved by the former dropping to meet with the latter.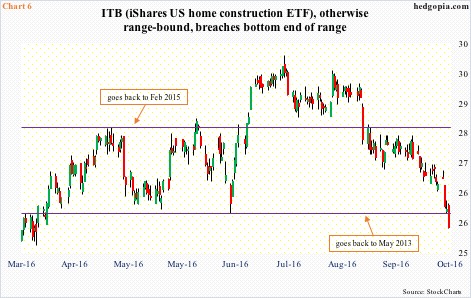
Amidst all this, it is no surprise that ITB, the iShares U.S. home construction ETF, was range-bound – between $28-29 and just under $26 (Chart 6). Until this week, that is.
Early July, ITB ($25.39) broke out of that range, rallying to $29.97 later that month. Turns out it was a false breakout. In the subsequent sell-off, it lost both 50- and 200-day moving averages.
So far this week, the ETF is down 4.3 percent, and yesterday lost the afore-mentioned support. Daily and weekly conditions are grossly oversold. A bounce is due, but it needs to stabilize first. Too soon to say if it is a false breakdown, but worth watching.
Thanks for reading!
