
ITB, the iShares U.S. home construction ETF, has posted seven straight positive months. The rally began last November – post-election.
Momentum is not broken, but is not in acceleration either. May was essentially unchanged – up 0.25 percent – with a monthly long-legged doji to boot. June starts out strong, up 1.4 percent in the first session, with a long way to go still.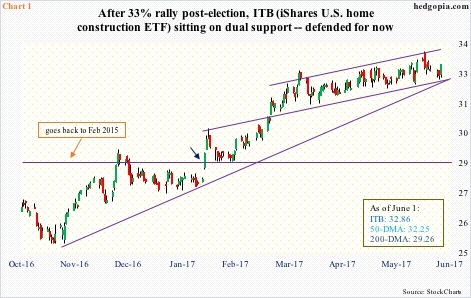
From intraday low to high between November 9 last year and May 23 this year, the ETF surged 33 percent, also breaking out of a longstanding range between $25-26 and 28-29 (blue arrow in Chart 1).
The rally stopped on May 23, when it produced a big engulfing bearish candle. The ETF came under some pressure after that, testing the 50-day moving average Wednesday, followed by a rally off of that on Thursday. Potentially important: the average has a flattish look to it, as ITB has essentially gone sideways for two and a half months now.
Overbought on weekly and monthly basis, it has room to go lower. The weekly chart is about to flash a bearish MACD cross-under. That said, near term, how it acts around that big engulfing candle of six sessions ago will be a big tell.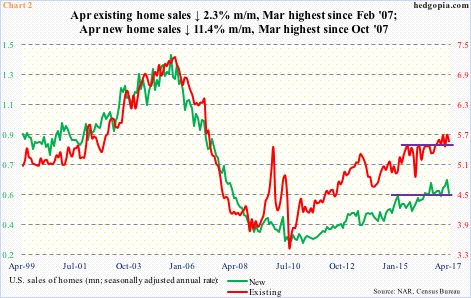
The somewhat lethargic action in the past several weeks has come even as sales of both new and existing homes reached multi-year highs in March.
[The ETF’s top five weights comprise 44 percent – DR Horton (DHI), 11.6 percent; Lennar (LEN), 10.9 percent; NVR (NVR), 8.5 percent; Pulte Group (PHM), seven percent; and Toll Brothers (TOL), 6.1 percent. These are all home builders.]In March, U.S. sales of new homes reached a seasonally adjusted annual rate of 642,000 – the highest since October 2007. Existing home sales were 5.7 million (SAAR) – the highest since February 2007 (Chart 2).
April sales were down month-over-month – new homes down 11.4 percent and existing down 2.3 percent. At least near term, the latter likely weakens further.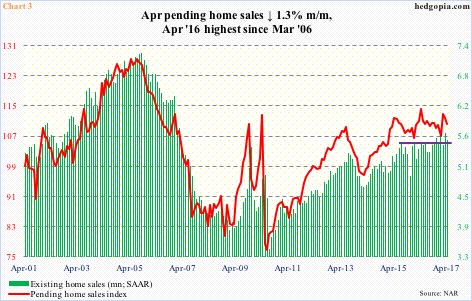
Pending home sales, which are based on contract signings hence act as a forward-looking indicator, were down 1.3 percent m/m in April to 109.8. They were also down 0.9 percent in March. The cycle high 113.6 – a 10-year high – was reached in April 2016.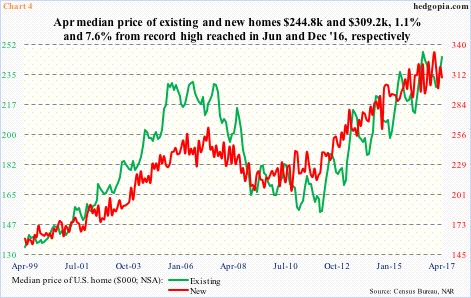
It is too soon to say if March marks a major peak in sales. Interest rates are low. The economy continues to churn out jobs. These are the positives. But income growth is sluggish. And prices are prohibitively high.
Sales of both existing and new homes are nowhere near the bubble highs (Chart 2), but prices have galloped way ahead.
The median price of a new home peaked at $332,700 last December and existing at $247,600 last June. April was $309,200 and $244,800, respectively (Chart 4).
Consider this. From June 2009 (Great Recession ended that month) to the March high, the median price of a new home jumped 55 percent. In the meantime, from the recession-end through April this year, U.S. disposable personal income/capita (current dollars) went from $35,707 to $44,394 – up 24.3 percent. The mismatch is a headwind to housing.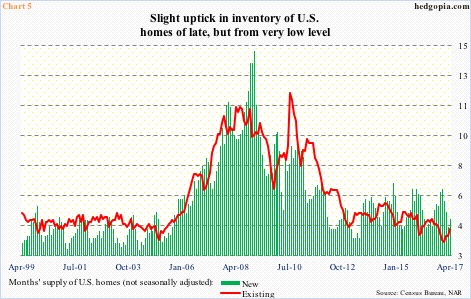
But because ‘supply of homes’ is low, prices have remained elevated at a higher plateau.
In April, months’ supply stood at 4.2 for existing homes and 4.8 for new. They have risen slightly of late, but from historically low levels (Chart 5).
Home builders have not responded to this supply/demand mismatch by aggressively breaking ground on new projects.
Housing starts in April were down 2.6 percent m/m to 1.17 million units – 11.7 percent lower since reaching 1.33 million last October, which was the highest since August 2007.
In other words, there is less availability of homes, and what is available is moving up in price. This in due course can come at a cost. Unless prices correct, sales start getting hurt.
This is probably what is reflected in the sideways action on ITB, which was also sitting at a confluence of two trend line support – one from November last year and the other from late January this year (Chart 1). A break of the November trend line in particular potentially opens the door for a breakout retest of 28-29. Thursday, bulls denied shorts of an opportunity, but face a difficult task medium term.
Thanks for reading!
