
The so-called January barometer – as goes January, so goes the year – is on the verge of providing an early warning for 2016.
January is believed to benefit from a seasonal anomaly favoring stocks. The January effect occurs when investors sell stocks in December to buy them back in January. This could be due to tax reasons (selling stocks at year-end to reinvest in the new year) or due to year-end bonuses put to work, or something else.
If January starts out negative, it is widely perceived to be a bad omen for the year.
Wall Street is full of such calendar clichés.
We have all heard of ‘sell in May, and go away’ or of the positive November-January seasonality, or for that matter, November to April. Then there is Santa Claus rally, or even the Super Bowl indicator.
They don’t always work. Makes sense.
Last year, ‘sell in May, and go away’ worked but barely, with the S&P 500 only down 0.3 percent between end-April and end-October. But Santa Claus failed to show up on the Street as the S&P 500 lost 2.3 percent between Christmas Eve and the first session post-New Year’s day. The presidential cycle, which says the third year’s returns are the strongest, failed to materialize either.
One did work. January was down last year – down 3.1 percent. And the S&P 500 lost 0.7 percent for the year.
As far as the January barometer goes, the year 2016 is not starting out great. With four sessions left, the month is so far down 8.2 percent. Only a miracle can save it from going negative.
But how reliable is this indicator?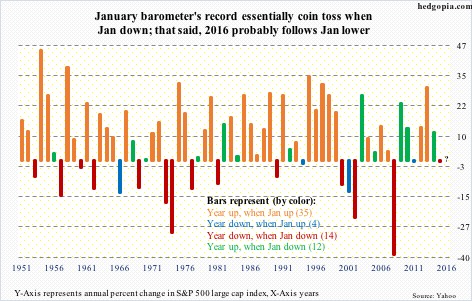
The chart above looks at the S&P 500 annual returns going all the way back to 1951. There are 65 bars, and 2016 is filled with a question mark.
Notably, 47 – nearly three-fourths – are up years, and 18 down.
The data is divided into four buckets: (1) years that were up when January was up, (2) years that were down when January was up, (3) years that were down when January was down, (4) years that were up when January was down. In parenthesis is the number of years for each bucket.
Right off the bat, orange bars jump out. There are just too many of them. When January is up, the odds of the year ending in the green rises substantially. Of the 47 ‘up’ years, January was up in 35 – nearly three-fourths of the time.
Similarly, of the 65, January has been up 39 times, and down 26 – so up three-fifths of the time. Of the 39 in which January is up, only four are down.
On the other hand, of the 26 in which January is down, there is essentially no signal – 12 up, 14 down. It could go either way. Odds are 50/50.
Hence as a signal ‘as goes January, so goes the year’ is statistically strong only if it is an up month. If it is down, the year could go either way – statistically not very significant.
That said, given earnings deceleration, maturing business cycle, small-caps and transports severely lagging, and a whole host of other reasons, 2016 may just turn out to be another down year with a down January.
Thanks for reading!
