
January ended up 1.6 percent. Historically, an up January bodes well for the rest of the year. This may very well be the case this year, but one should not be oblivious of how overbought the S&P 500 is.
Following a 2023 in which the S&P 500 jumped 24.3 percent, 2024 picked up where it left off. In the first month, it rose 1.6 percent, which is much weaker than the 6.2-percent rally the large cap index put up in January last year, but an up January nevertheless bodes well for the year.
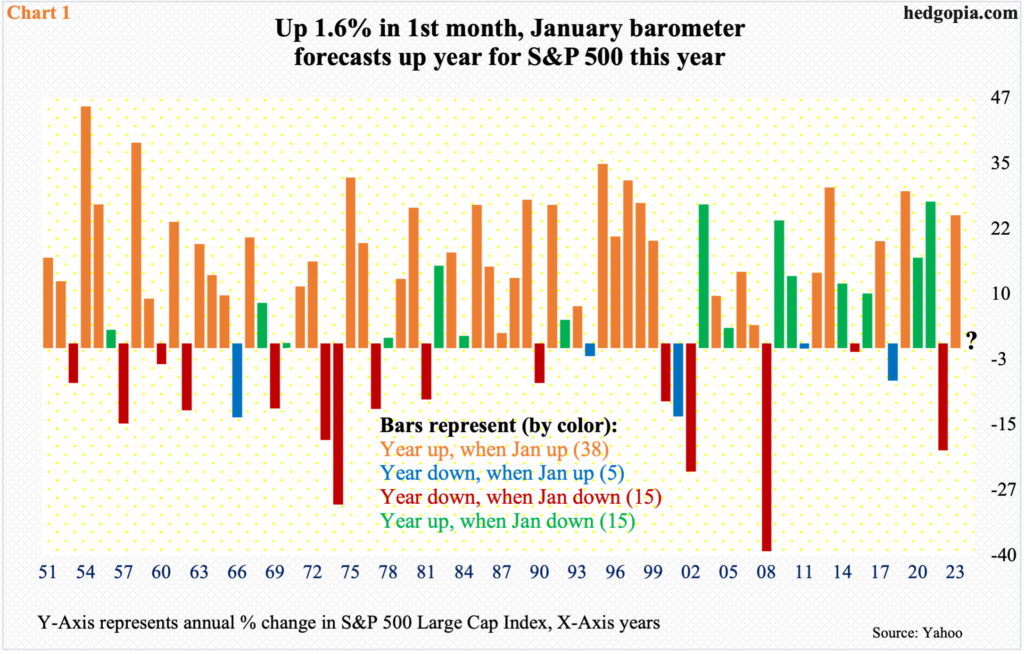
Investors widely believe that as goes January so goes the year. The so-called January barometer’s record when the month is up is strong.
Chart 1 plots the annual performance in the S&P 500 going back to 1951 – for a total of 73 years. The data is divided into four buckets: (1) years that finished up when January was up, (2) years that finished down when January was up, (3) years that finished down when January was down, and (4) years that finished up when January was down. The number of years corresponding to each bucket are put in parenthesis.
It turns out the January barometer’s success rate is strong when January ends in the green. Out of the 73, this occurred 38 times; there were only five years that ended down with an up January. This is a very high success rate. In contrast, the record of a down January is mixed right down the middle, with the year ending up or down 15 times each, which is nothing but a coin flip.
This bodes well for the rest of the year. That said, this of course is not etched in stone. Thus far, February is following firmly on the footsteps of January with the first two sessions alone bringing gains of 2.3 percent. This, at the same time, questions the sustainability of the move.
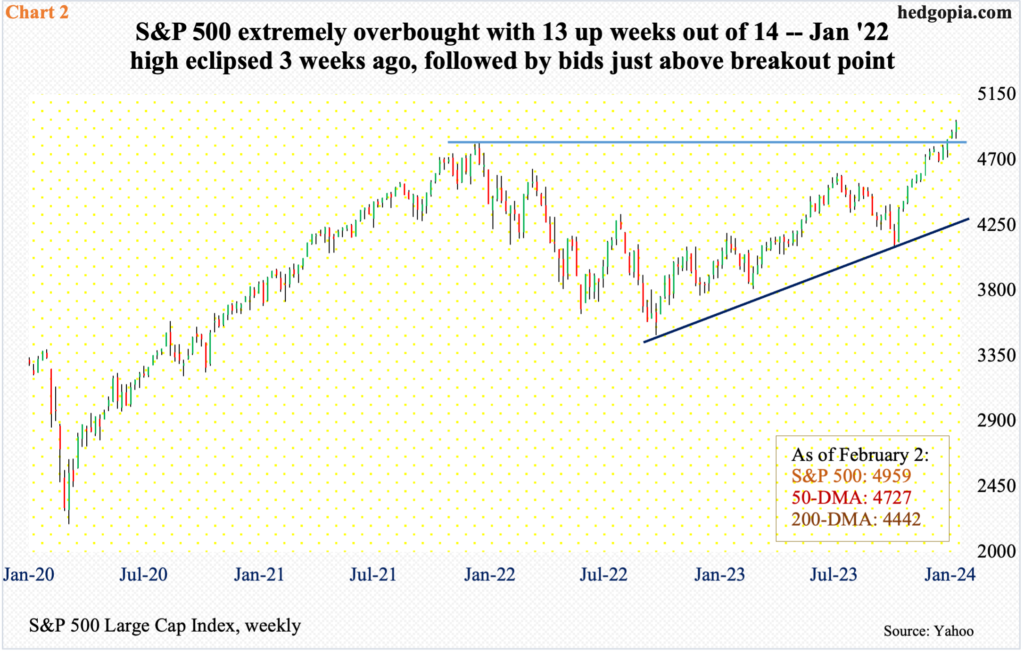
The S&P 500 bottomed late October last year at 4104. Last Friday, it ticked 4975, with a session close of 4959, up 1.4 percent for the week. This was the fourth consecutive up week – and the 13th in 14. From the October low, it is up north of 21 percent.
Conditions are extremely overbought, with the weekly RSI at 72.71. Concurrently, breadth is narrowing, with the percentage of S&P 500 stocks above the 50-day moving average last week down 10.2 percentage points week-over-week to 66.4 percent.
Investors Intelligence’s bullish percent, in the meantime, jumped 4.8 percentage points w/w to 57.7 percent last week (as of Tuesday). This metric is yet to hit 60, which may very well happen in the best of circumstances, but the fact remains that last week’s reading was the highest since mid-July 2021.
In the event of a pullback, short-term support lies at 4900, followed by the important 4800-4810s. Three weeks ago, the index eclipsed the prior record high of 4819 from January 2022, followed by bids at 4840s in the following couple of weeks. Given how extended several metrics are, it is just a matter of time before another retest occurs. Bulls’ failure to defend the breakout will open up opportunities for the bears.
Thanks for reading!
