
January was ugly, with the S&P 500 down 5.3 percent. The January barometer is predicting a down year this year. But the track record of a down January is mixed; both 2020 and 2021 began the year with a down January but ended the year up. That said, the dynamics this year are different – particularly as relates to the Fed and the interest rate environment. This year, the odds of ‘as goes January so goes the year’ being true are substantially higher.
There is a widely-held belief among investors that as goes January so goes the year. The so-called January barometer is predicting a down year this year. The S&P 500 began 2022 by dropping 5.3 percent last month.
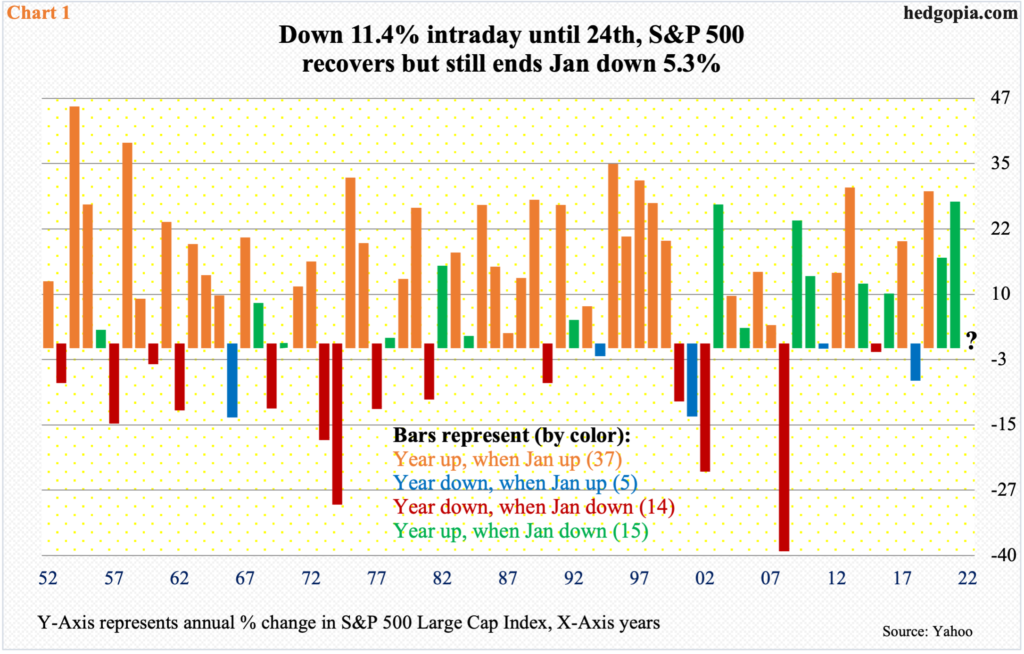
The consolation for equity bulls is twofold. (1) The large cap index peaked early, on January 4 at 4819, before tumbling as much as 12.4 percent by the 24th. It then rallied strongly from that low, ending the month down only 5.3 percent. (2) The January barometer’s record when the month is down is mixed.
Going back to 1951 – 71 years in total – there have been 29 years in which the year started with a down January. In 14 of them, the year ended in the negative, while in the other 15 it closed higher. In fact, 2021 was a second year in a row in which the year ended higher with a down January (Chart 1).
The barometer’s record is much more definitive when January starts strong. In 42 of the 71 years, January ended in the green. In 37 of them, the year followed January higher; only five were down.
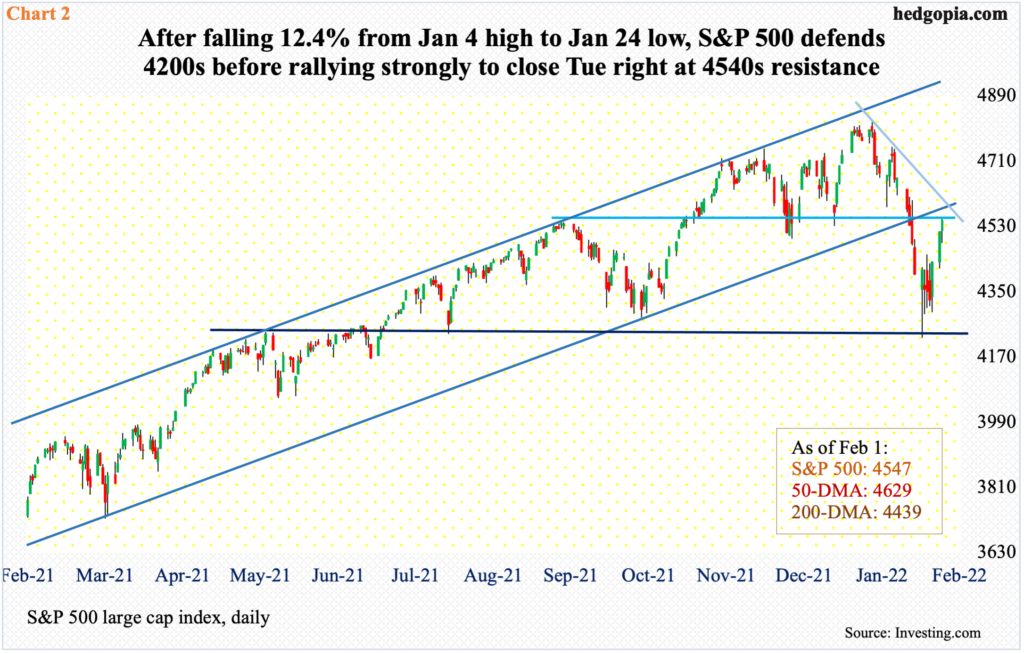
Going by the barometer’s record, it is a coin toss as to how 2022 might end. Bulls took a hit early on but should be happy how they performed in the last several sessions. The S&P 500 rallied 5.2 percent in the last couple of sessions from last Friday’s low. The momentum continued Tuesday, rallying 0.7 percent, ending right at 4540s horizontal resistance (Chart 2).
Earlier, bids showed up on January 24 near the highs from last April and May; in fact, a massive bullish hammer reversal showed up in that session. Buying pressure was evident in subsequent sessions as well.
The 200-day moving average (4439) has been recaptured. The 50-day lies at 4629; should 4540s give way, this will be a good test of bulls’ mettle, as this is where they face trend-line resistance from the January 4 high.
One thing is for sure. January’s brisk selling indicates there are a lot of nervous bulls out there. Major US equity indices, including the S&P 500, have suffered technical damage, and need tons of repair work. The interest-rate dynamics have probably changed in favor of the bears. Put all this together, it is unlikely the January barometer follows the path of the last two years this year.
Thanks for reading!
