
U.S corporate bond issuance slowed down in January, but it is too early to read too much into this.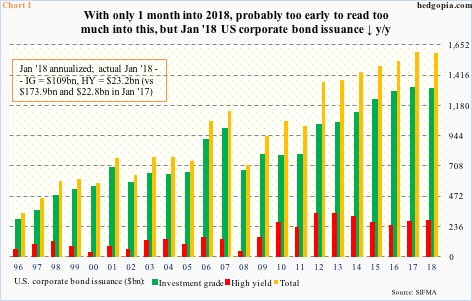
In the first month of the year, corporations issued $109 billion in investment-grade (IG) and $23.2 billion in high-yield (HY) – for a total of $132.2 billion. This compares with $196.7 billion, comprised of $173.9 billion in IG and $22.8 billion in HY in the corresponding period last year.
In Chart 1, the bars for 2018 have been arrived at by annualizing January’s numbers. This is just one month’s data, so not to be taken seriously. But for illustrative purposes, it helps drive home a point. If – a big IF – the trend persists, 2018 will be a down year.
This comes after massive issuance post-Great Recession.
In 2009 through 2017, a total of $11.8 trillion was issued. Last year, issuance rose 4.3 percent to $1.59 trillion. With 11 more months to go, 2018 is on track for a 0.4-percent drop. If it holds up, this would be the first decline in seven years.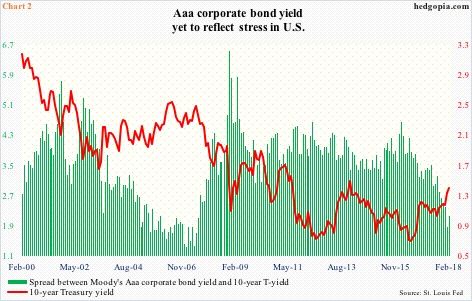
Is demand becoming an issue? At least looking through the eyes of yields, it does not appear so.
Moody’s Aaa corporate bond yields continued to edge lower throughout 2017, dropping from 4.06 percent in December 2016 to 3.51 percent one year later (violet box in Chart 3).
Concurrently, 10-year Treasury yields bottomed at 2.03 percent early September last year, then rising to 2.88 percent last Thursday. Aaa corporate yields are beginning to inch higher as well, ending last Friday at 3.82 percent.
The spread between the two was 0.83 percent in January. This was the lowest since 0.76 percent in June 2007, and rose to 0.98 percent last Friday – still very low historically (Chart 2).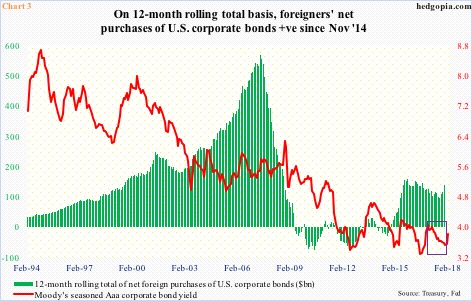
At least one source of demand for U.S. corporate bonds is intact.
On a 12-month rolling total basis, foreigners’ net purchases of U.S. corporate bonds totaled $137.3 billion in November. This is nowhere near peak purchases of $567.4 billion in May 2007. Nonetheless, the green bars in Chart 3 have been positive since November 2014. (December’s numbers are due out this Thursday.)
Chart 3 also shows Aaa yields which have essentially gone sideways for nearly six years now. This supposed stability cannot and will not continue forever. The cycle will end. The question is, are we at an inflection point? Is this what the 15-basis-point month-over-month increase in Aaa yields February-to-date suggesting?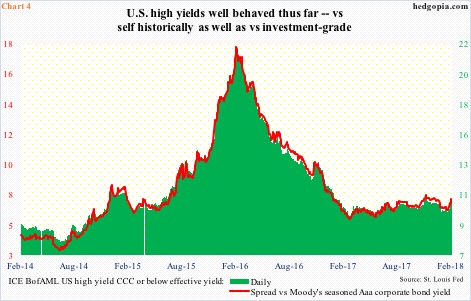
On a related note, yields on ICE BofAML US high yield CCC or below ended last week at 10.98 percent, up from 10 percent on January 26th. These are very high yields. We are of course talking companies in the junk territory. At the same time, back in February 2016, they were yielding as high as 21.68 percent (Chart 4).
Along the same lines, the spread between HY and IG has risen after bottoming on January 26th, but nothing out of the ordinary. This will of course change if we are indeed at an inflection point, and if this is what is being reflected in January’s issuance data. The problem, once again, is this is one month’s data. We will at least need a few more months to gauge if there has been a trend change, hence worth watching.
Thanks for reading!
