
As soon as the June payroll report hit the tape pre-open last Friday, markets heaved a big sigh of relief. Reversing the downwardly revised 11,000 non-farm jobs in May, 287,000 jobs were created in June. The S&P 500 large cap index celebrated with a 1.5-percent pop.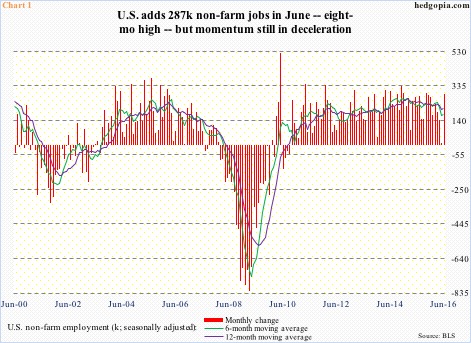
The June print was the highest in eight months (Chart 1), and was nearly twice the monthly average of 148,000 in the prior five months.
Was June an aberration or would this thrust continue?
First off, momentum is in deceleration… has been for a while. The six-month average of monthly change in non-farm payroll has been below that of the 12-month in 14 out of last 16 months (Chart 1).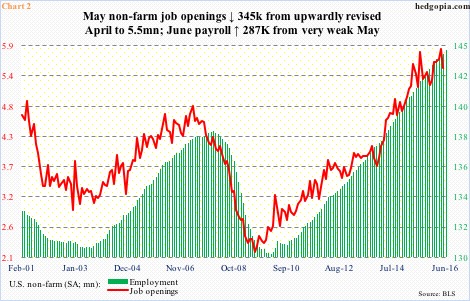
Secondly, job openings (as per the JOLTS report) tend to be a good indicator of what is to come in employment. In Chart 2, non-farm employment and job openings track each other well, with the latter leading.
May’s job openings were reported Tuesday, and they declined 345,000 month-over-month to 5.5 million. April was revised up by 57,000 to 5.85 million – an all-time high. Prior to this revision, April tied the July 2015 tally of 5.79 million. In other words, job openings have been flattish for nearly a year now.
As mentioned earlier, the June payroll print was fantastic. So would June see a revival in job openings? Possible.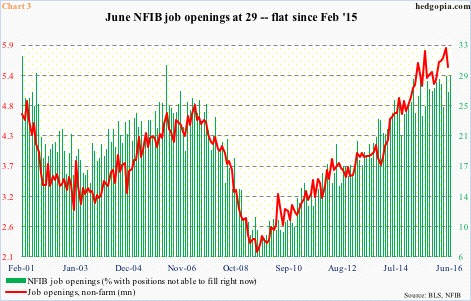
The National Federation of Independent Business’s job openings sub-index, which was also published Tuesday, rose two percentage points to 29 in June. The number indicates the percent of small businesses with positions not able to fill right now.
But here is the thing. The green bars in Chart 3 have been flattish since February last year. Another instance of stagnation in job openings. The sideways pattern in these bars has been witnessed following a long period of persistent increase since Great Recession ended. Fatigue might be setting in, and, if so, should not come as a surprise.
In a related note, in Chart 4, the ratio of job openings to unemployed has been pitted against the ratio of quits to hires. (The latter two are from the JOLTS report.)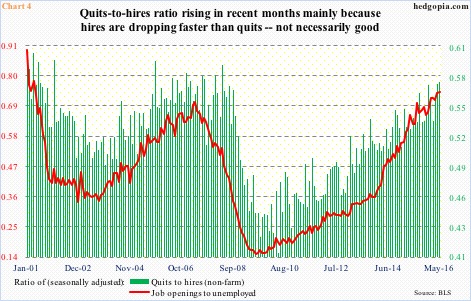
On the surface, the green bars in Chart 4 still look to be trending up – a sign of healthy job market. The ratio, however, can rise two ways: either the numerator rises more than the denominator, or the latter drops more than the former.
Accordingly, hires dropped from 5.51 million in February this year to 5.04 million in May. Quits dropped from 2.96 million to 2.9 million during the period. The ratio apparently rose because quits dropped less than hires did. But within what on the surface looks like an improving trend, it is worth pointing out that quits have essentially been flat since August last year – 2.86 million back then versus 2.9 million in May. This is a sign that employees are increasingly cautious about quitting their jobs.
In a healthy job market, workers show no hesitancy in quitting as they expect to land a new one in no time. The current trend in quits indicates that is no longer the case, which, in turn, lends credence to the sideways tendency seen in job openings.
Thanks for reading!
