
The pace of U.S. corporate bond issuance slowed in June.
Corporations issued $110.8 billion in non-convertible debt and $3 billion in convertible debt last month.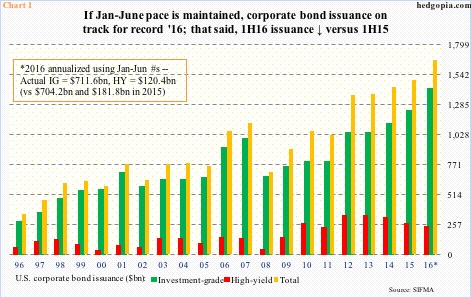
Of non-convertible debt, which is what Chart 1 portrays, investment-grade (IG) was $86.8 billion and high-yield (HY) $24 billion, for a total of $110.8 billion. The latter was down 46.1 percent month-over-month and down 8.7 percent year-over-year. Similarly, IG was down 50.9 percent m/m and down 12.9 percent y/y. HY was down 16.4 percent m/m and up 10.5 percent y/y.
Monthly data tends to be volatile. Plus, June was also a down month last year. Smoothed numbers serve our purpose better.
In the first six months this year, issuance totaled $831.9 billion, of which $711.6 billion was in IG and $120.4 billion in HY. Annualizing it would get us to $1.66 trillion, $1.42 trillion, and $240.8 billion, in that order. On this basis, both the yellow and green bars in Chart 1 would be at a new record, while the red bar would be dropping for the third straight year.
But is this the right way to look at this?
Total issuance in the first half last year was $886 billion, IG $704.2 billion and HY $181.8 billion. Once again, this year they respectively stood at $831.9 billion, $711.6 billion and $120.4 billion. Hence on an aggregate basis, issuance this year is down 6.1 percent, up one percent, and down 33.8 percent, respectively.
Here is the rub. Last year, second-half issuance was worse than the first half. In fact, a lot worse. Total issuance was down 31.5 percent, IG down 25.1 percent and HY down 56.6 percent. HY primarily suffered last year due to energy.
If issuance follows anywhere near last year’s 2H swoon, 2016 would look a lot different from what the annualized numbers in Chart 1 show.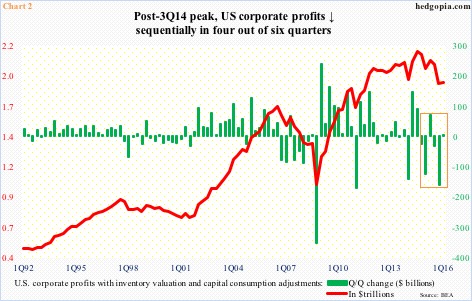
This would have come amidst corporate profits that already peaked and are in deceleration. In 1Q16, profits adjusted for inventory and depreciation were at a seasonally adjusted annual rate of $1.9 trillion, essentially flat sequentially. Profits peaked at $2.16 trillion in 3Q14, and have been down sequentially in four out of the last six quarters (Chart 2).
Along the same lines, operating earnings of S&P 500 companies peaked at $262.9 billion in 3Q14, then dropping to $202 billion in 4Q15, before rising slightly to $209 billion in 1Q16.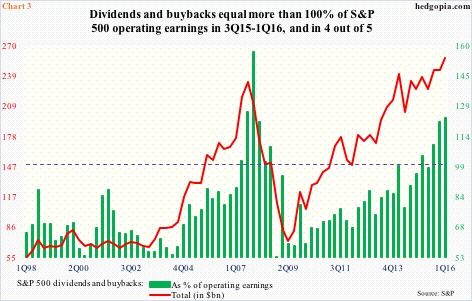
Here is the kicker! In the three quarters to 1Q16 and in four out of the last five, dividends and buybacks combined made up well north of 100 percent (Chart 3). They were $257.7 billion in 1Q16. In other words, S&P 500 companies have been biting more than they can chew. Either earnings have to massively reverse the hitherto decelerating trend – a tall order – or buybacks/dividends get cut.
Alternatively, corporate bond issuance picks up speed in 2H, and fills the void. Issuance has done exactly that for the last several years (Chart 1).
Hence the significance of 2H issuance this year. And it is a toss-up really. On the basis of first six months annualized, issuance is on course for yet another record. But based on how things panned out in 2H last year, issuance is on track for a weak 2H. And the latter scenario probably does not bode well for the red line in Chart 3.
Thanks for reading!
